

UNSILOED_CHART. The function downloads a chart
image, asks Unsiloed for a chart-ready Markdown table, and converts the table to
numeric spreadsheet values. The finished formula looks like this:
A2. The value in B2 triggers another
status check when parsing takes longer than one formula execution. An optional
third argument returns a numeric x-axis for scatter charts. In the example
below, Unsiloed extracts 20 quarters from a dual-axis chart, including revenue
in millions of pounds and margin as a percentage. We then rebuild it as an
editable combination chart.
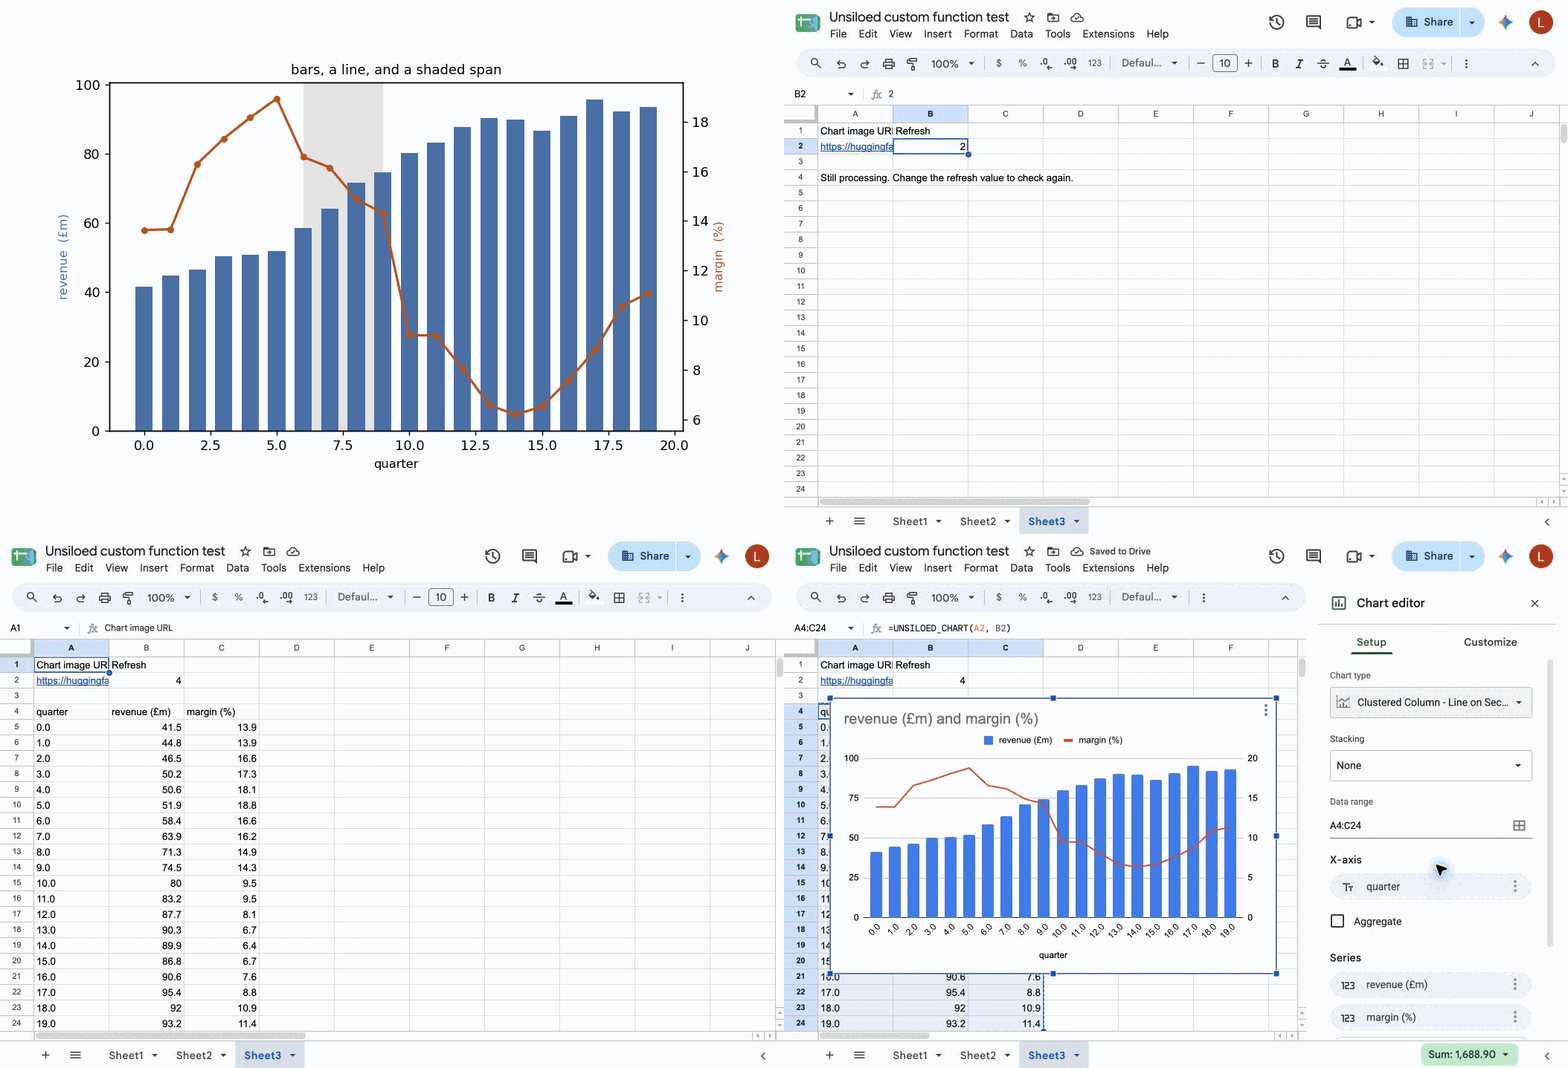
Custom functions can return values but can’t insert or modify a Google Sheets
chart. After the data spills into the sheet, we’ll use Insert → Chart to
create an editable chart from it.
What We’ll Build
The custom function performs five operations:- It downloads a public chart image and uploads the bytes to
/parse. - It asks the page analyzer to end its response with one Markdown data table.
- It stores the returned job ID so later calculations can reuse it.
- It checks the job once during each calculation.
- It converts the table into validated, chart-ready rows and numeric series.
Show the Full Script
Show the Full Script
Paste this into
Code.gs, replacing its contents. The script reads the API key
from the script property configured in Step 3.Code.gs
Requirements for the Custom Function
Before you start, gather:- A Google account and a spreadsheet you can edit
- An Unsiloed API key from the Unsiloed dashboard
- A public PNG, JPEG, or TIFF URL that returns the image bytes
Step 1: Open the Apps Script Editor
The custom function lives in the Apps Script project attached to the spreadsheet. In Google Sheets, choose Extensions → Apps Script.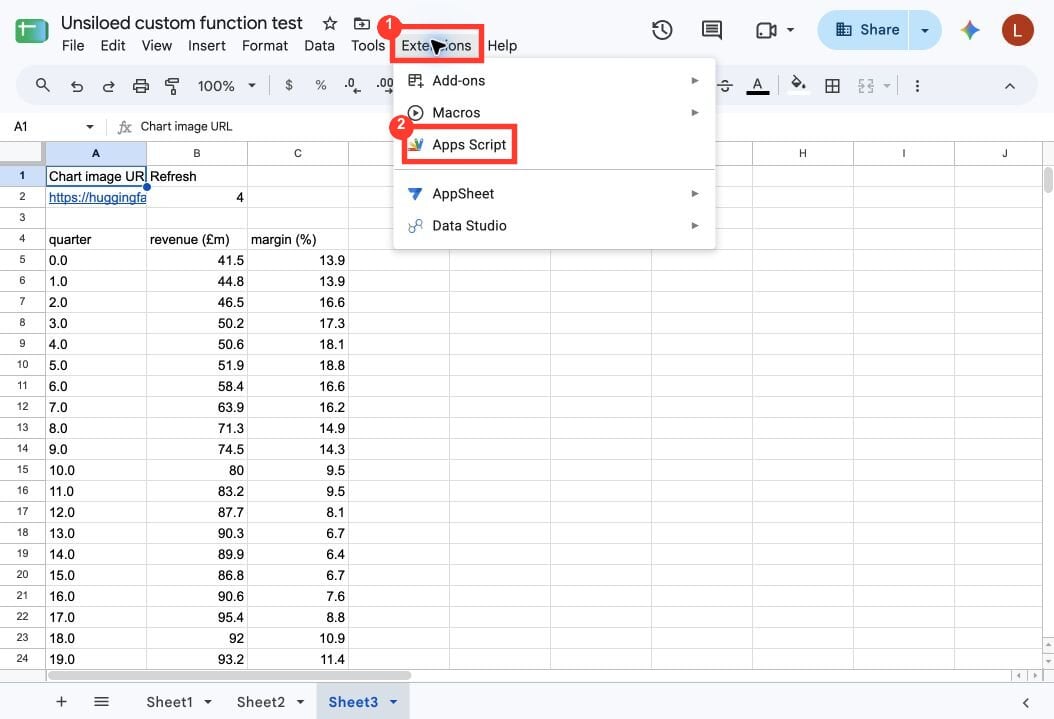
Code.gs in a new tab. Delete
the empty myFunction that Google adds to a new project.
Step 2: Build the Custom Function
We’ll build the same script in twelve focused sections. Keep each addition inCode.gs in the order shown below. If you copied the completed script from the
accordion, use this section to understand its request, cache, and
table-conversion logic.
2.1 Configure Chart Extraction
At the top ofCode.gs, add the API URL, cache limits, extraction prompt, and
API key helper:
Code.gs
UNSILOED_API_KEY in
Step 3.
2.2 Check the Parse Job
BelowunsiloedApiKey, add the function that Sheets calls:
Code.gs
@customfunction tag adds UNSILOED_CHART to Sheets autocomplete. Each
calculation performs one status request. If the job is still running, changing
refresh starts another calculation that checks the saved job ID.
2.3 Reuse or Create a Parse Job
BelowUNSILOED_CHART, add the helper that reads the cache before taking a lock,
then checks it again before submitting an image:
Code.gs
2.4 Validate and Clear Cached Jobs
BelowgetOrCreateChartJob, add helpers that reject malformed cache entries and
remove a failed or missing job without deleting a newer replacement:
Code.gs
2.5 Bound the Job Cache
BelowclearCachedChartJob, add cleanup and cache-key helpers:
Code.gs
2.6 Build the Chart Parse Request
BelowjobPropertyName, add the payload that tells Unsiloed how to analyze the
image and which response fields to return:
Code.gs
chart_data because the prompt already produces the
table. For charts embedded in multi-page documents, send extract_charts=true
instead and read the structured chart_data field on each chart segment. See
the parse job response reference
for that field.
2.7 Download the Source Image
BelowchartParsePayload, add the image downloader:
Code.gs
2.8 Send Authenticated API Requests
BelowfetchChartImage, add the shared request helper:
Code.gs
2.9 Select the Chart Data Table
BelowunsiloedRequest, add the helper that validates every extracted table:
Code.gs
TRUE as the optional third formula argument when a scatter chart needs a
numeric x-axis. In that mode, a missing or nonnumeric x value produces an error.
2.10 Parse Markdown Tables
BelowfirstChartRows, add the tolerant Markdown table parser:
Code.gs
2.11 Split Markdown Cells Safely
BelowisMarkdownRow, add the row parser and backslash helpers:
Code.gs
C:\temp keeps its literal backslash, while \| remains a pipe inside its
cell.
2.12 Validate Series and Numbers
At the bottom ofCode.gs, add the numeric-series and cell-value validators:
Code.gs
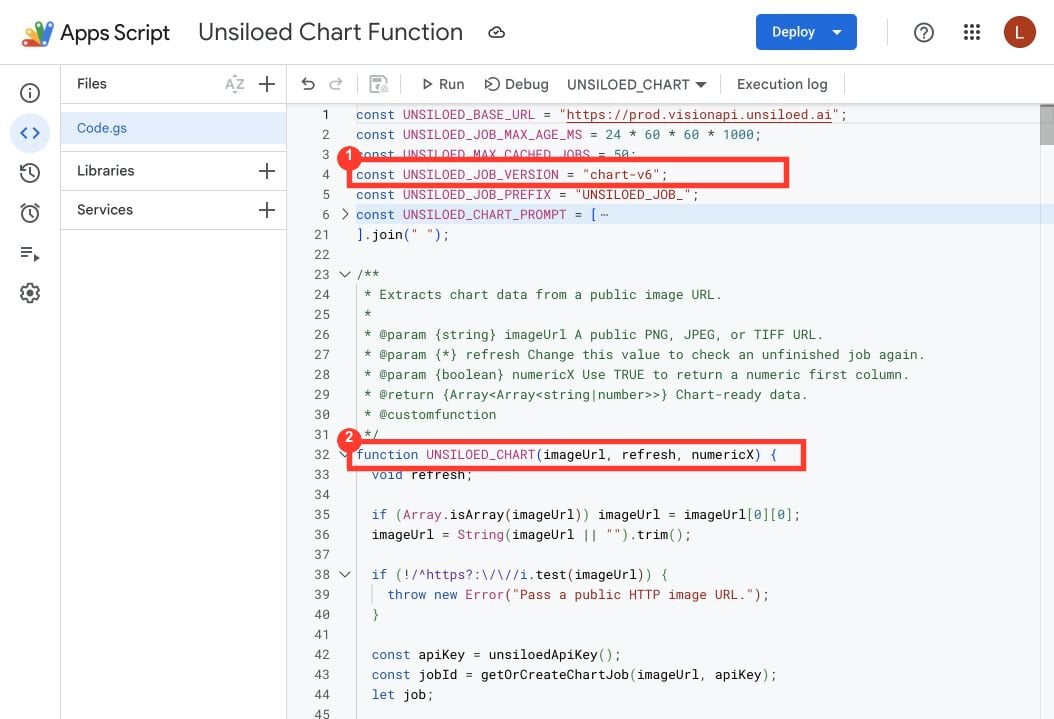
Code.gs contains all twelve sections, save the project and confirm that
Apps Script reports no syntax error. The finished script should use the
chart-v6 cache version and accept imageUrl, refresh, and numericX as
the function’s three arguments.
Step 3: Store Your API Key
Keep the API key out of spreadsheet cells and source code by storing it as a script property.1
Open the script properties
In the Apps Script editor, open Project Settings from the left sidebar.
Scroll to Script Properties, then click Add script property.
2
Add the API key
Set the property name to 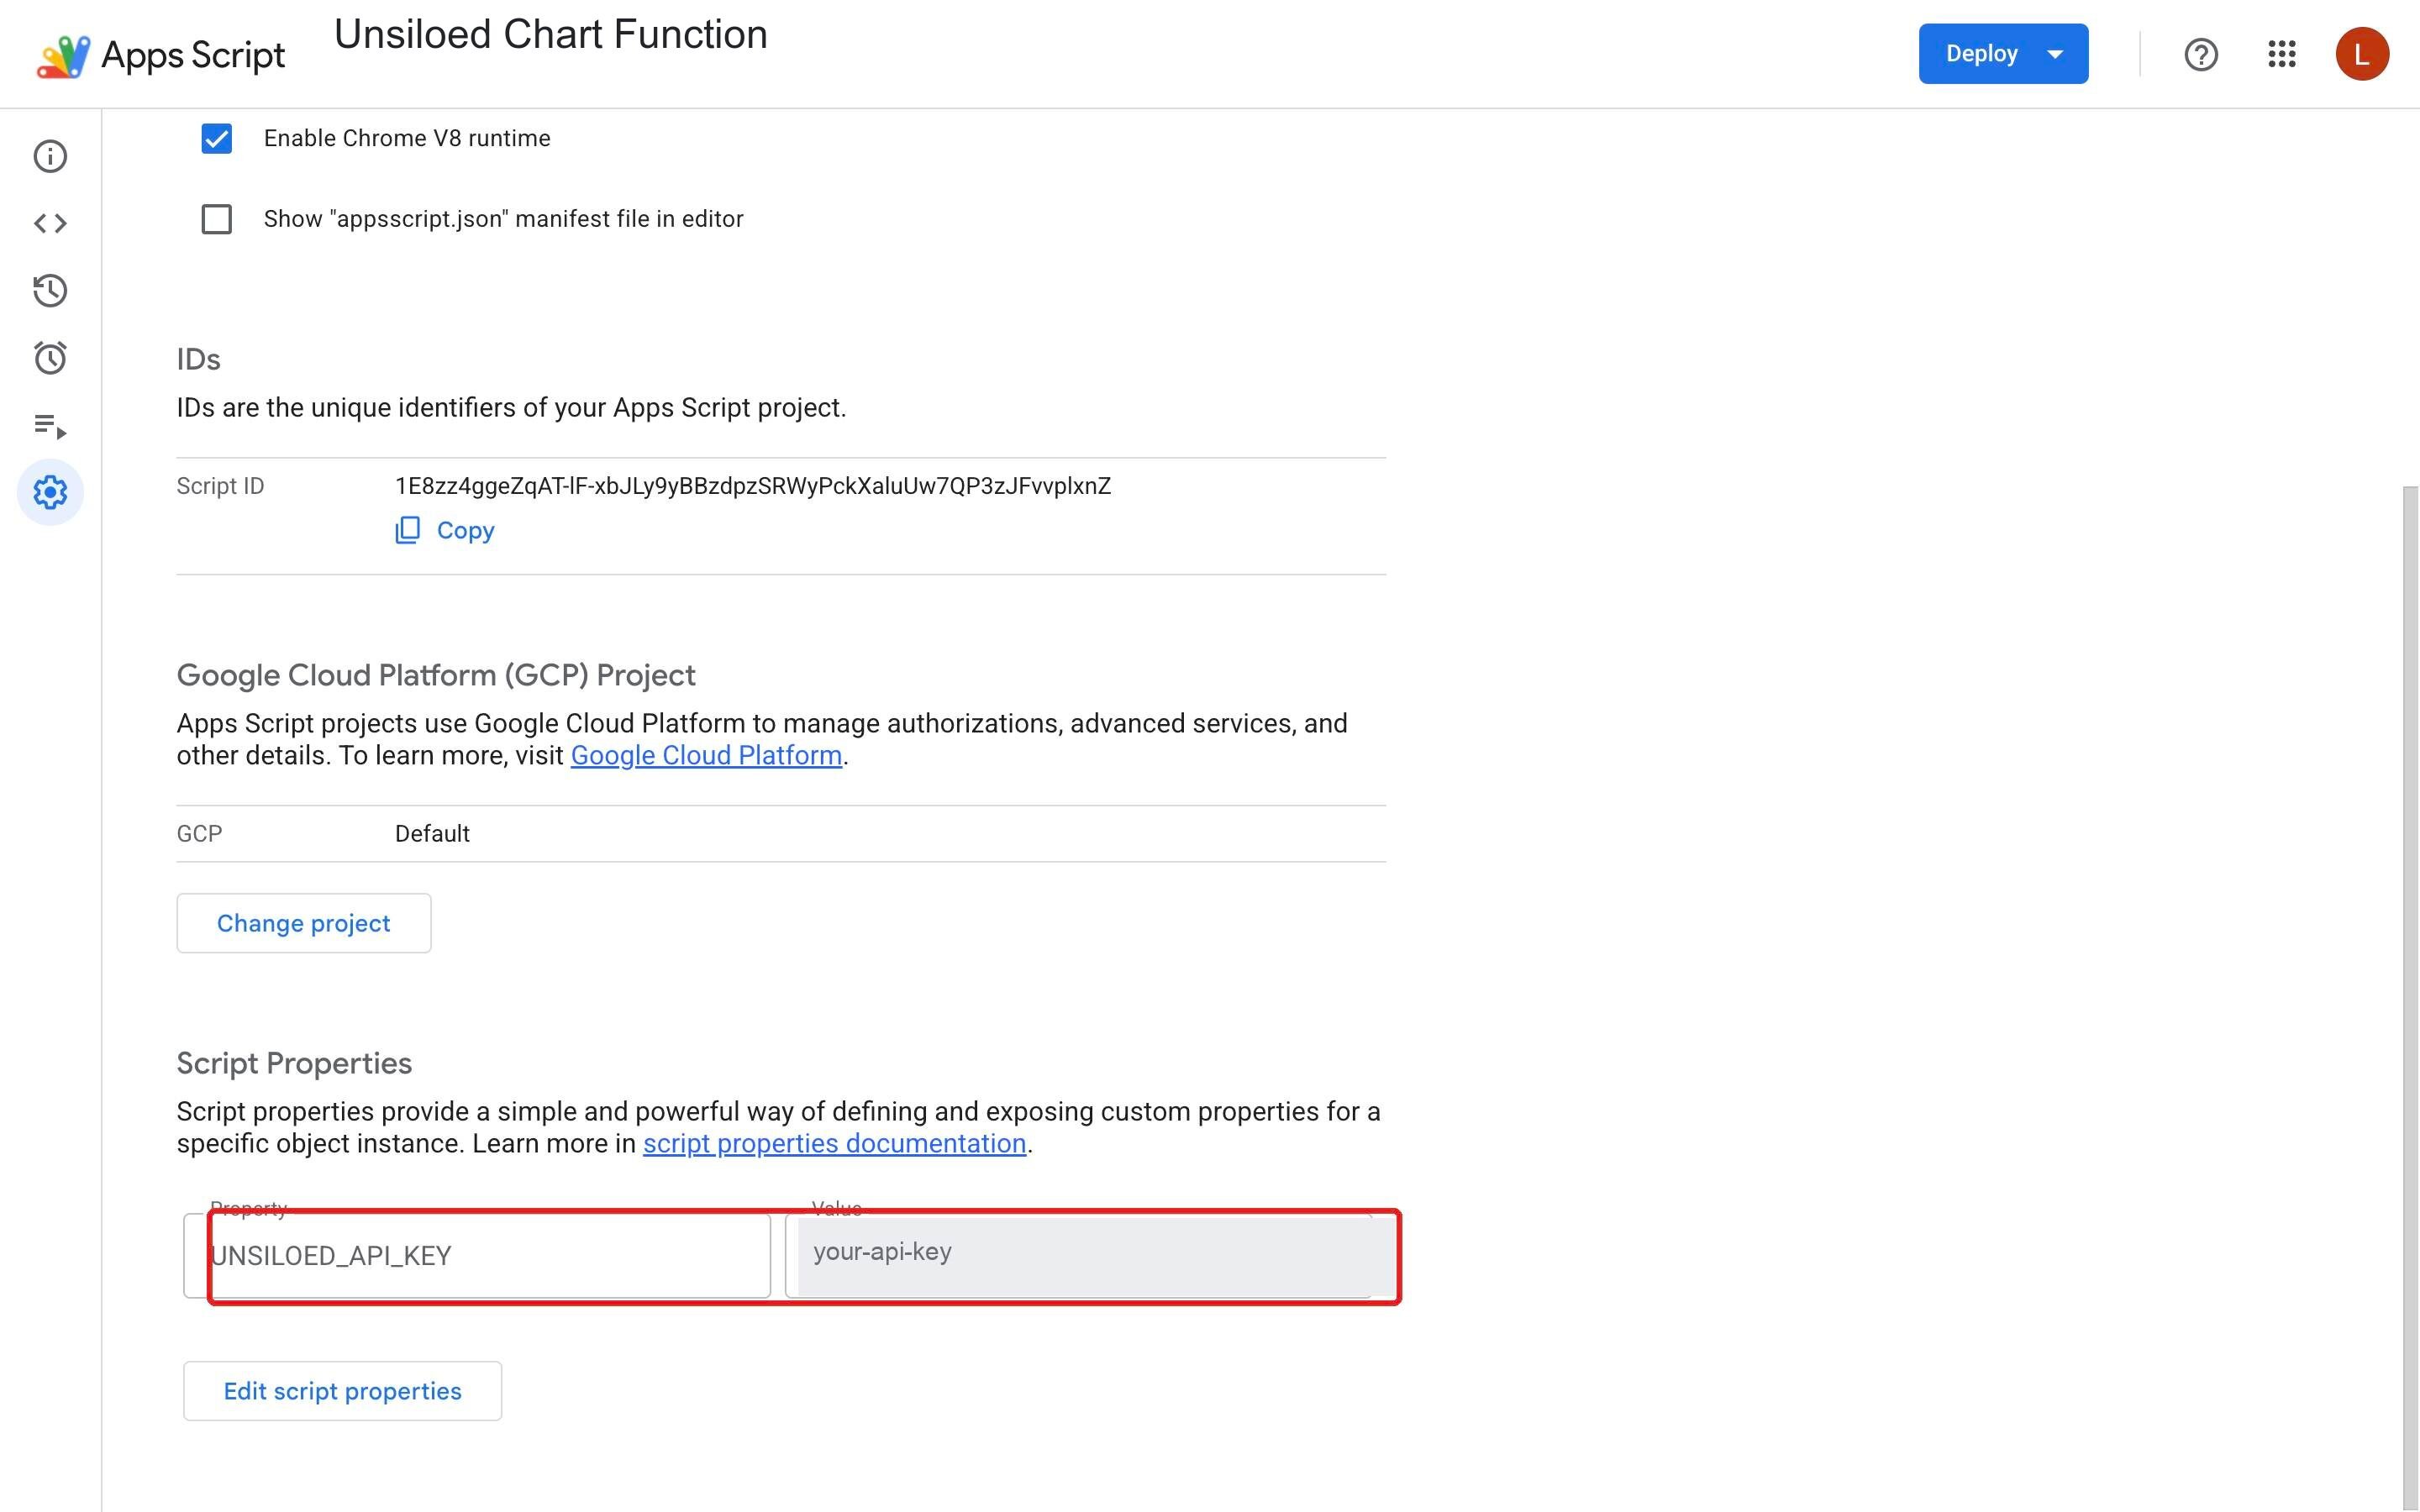
UNSILOED_API_KEY, paste your API key into its value
field, and click Save script properties.Step 4: Extract the Chart Data
We’ll keep the image URL and refresh value separate from the formula so a status check doesn’t require editing the formula text.1
Add the image URL and refresh value
Return to the spreadsheet and add these labels and values: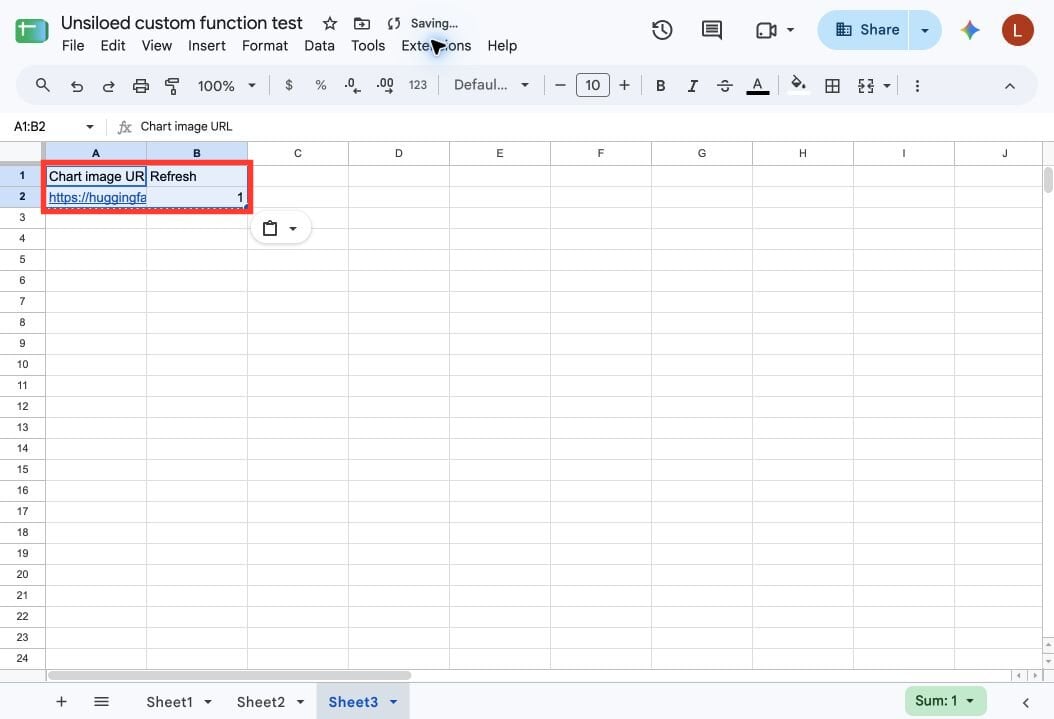
The red box shows the input range. The URL appears truncated in the cell,
but Sheets retains its complete value.
2
Run the custom function
Select For a scatter chart that needs numeric x values, use:Sheets displays
A4 and enter:Loading... while the function submits or checks the parse
job. Keep the cells below and to the right of A4 empty so the result has
room to expand.3
Refresh an unfinished job
The first calculation may return this status instead of data:Wait about 20 seconds, then increase 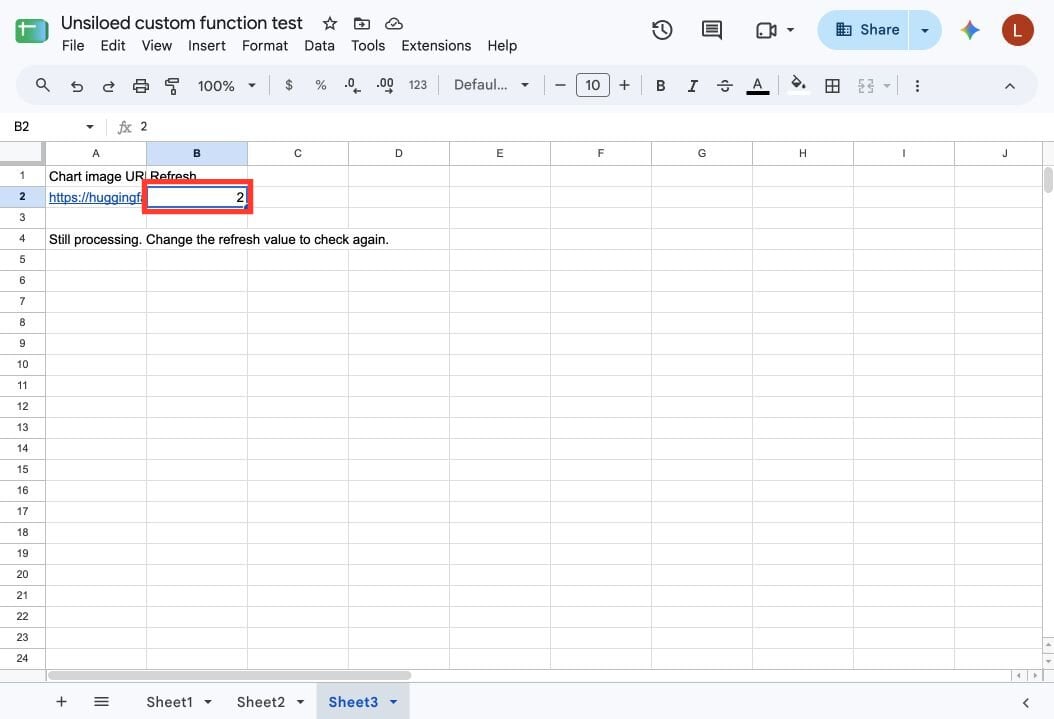
B2 from 1 to 2. Sheets
recalculates the function and checks the saved job instead of submitting
the image again. Repeat after another short wait if the job is still
processing.4
Review the extracted table
When the job succeeds, the formula expands into the chart’s categories and
series.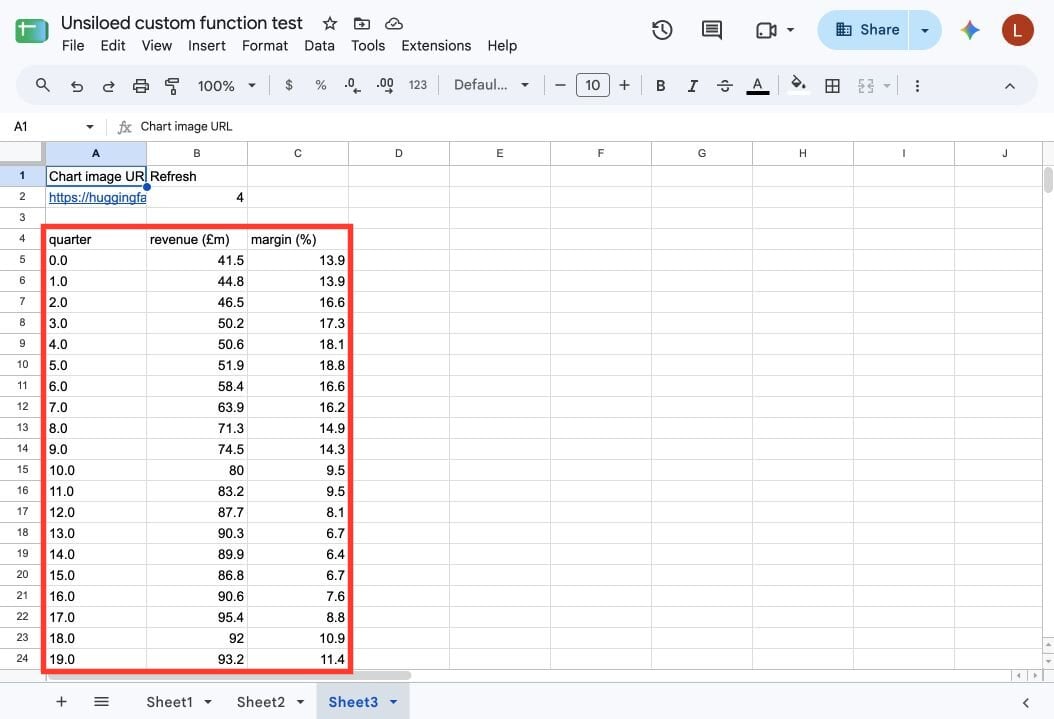
revenue (£m) and margin (%) units in the headers while estimating the plotted
values from the chart’s pixels. For example, the extracted quarter 7 margin is
16.2, while the synthetic source data is approximately 16.15. Verify values
against source data before using them for consequential decisions.
The margin values use a 0–100 percentage scale, so 13.9 means 13.9%. Don’t
apply Sheets’ percentage format, which would display that value as 1,390%.
Each image URL reuses a saved job for up to 24 hours, subject to the 50-entry
cache limit. To deliberately submit a fresh job, change
UNSILOED_JOB_VERSION, save Code.gs, and change B2. If you instead delete
its UNSILOED_JOB_... script property, also change B2 to recalculate the
formula.
Step 5: Recreate the Chart in Google Sheets
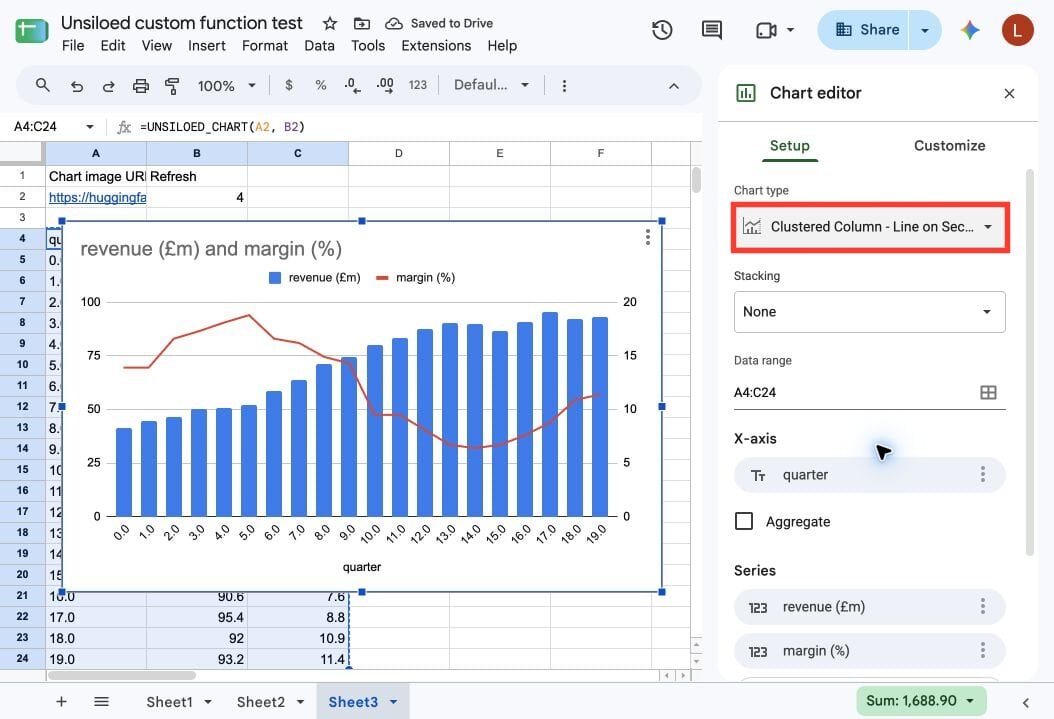
The extracted cells become the data source for the native chart. Select the extracted category and value columns, including their headers. Then choose Insert → Chart.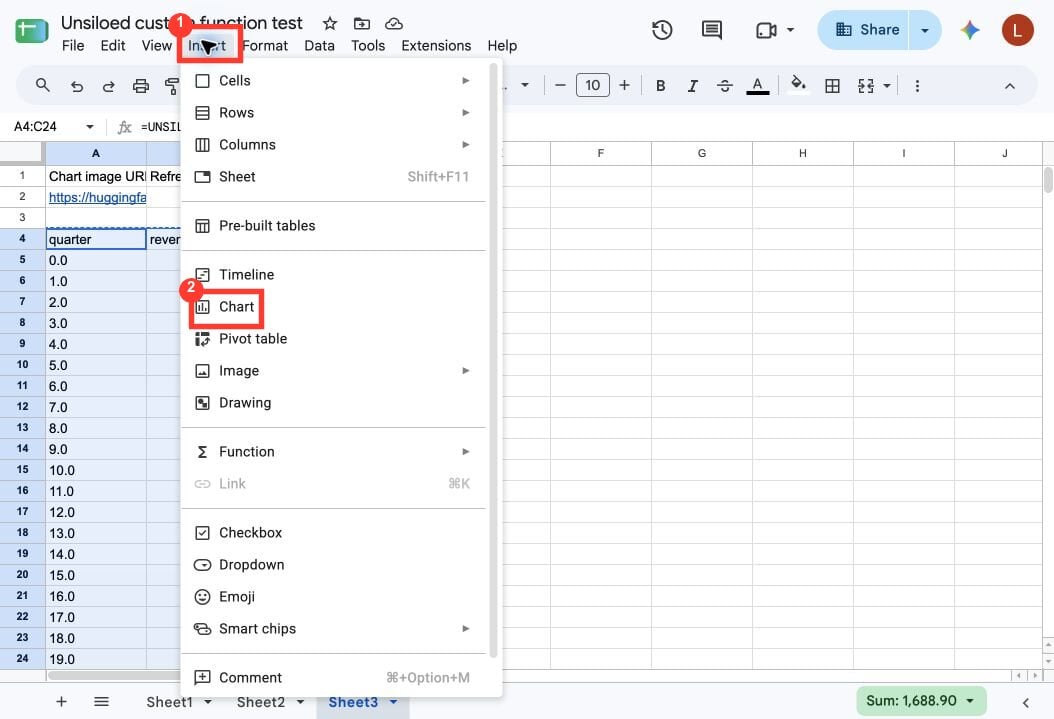
Troubleshoot the Custom Function
'Pass a public HTTP image URL'
'Pass a public HTTP image URL'
The first argument is empty, a filename, or a non-HTTP value. Put a complete
public or presigned image URL in the referenced cell.
'The URL did not return an image'
'The URL did not return an image'
The URL returned an HTML download page instead of image bytes. Use a direct
PNG, JPEG, or TIFF URL.
'Add UNSILOED_API_KEY to the script properties'
'Add UNSILOED_API_KEY to the script properties'
The bound script has no API key. Add the property in Step
3. Script properties aren’t copied with a
spreadsheet, so add it again in the copied sheet’s script project.
The cell says 'Still processing'
The cell says 'Still processing'
Wait about 20 seconds, then change the refresh value. The next calculation
resumes the existing job. Apps Script stops custom functions after 30
seconds, so a slow parse can require more than one check.
The formula says 'Try the formula again'
The formula says 'Try the formula again'
Another calculation briefly held the script lock. Change the refresh value
after a few seconds. This reuses the existing job when one is available.
The API returns an HTTP or credit error
The API returns an HTTP or credit error
Temporary HTTP errors usually resolve on a later refresh. For an account or
credit error, check the Unsiloed dashboard before retrying.
The result could not expand
The result could not expand
Clear the cells below and to the right of the formula. Sheets doesn’t let a
spilled array overwrite existing values.
Sheets rejects the formula separator
Sheets rejects the formula separator
Some spreadsheet locales use semicolons between arguments. Enter
=UNSILOED_CHART(A2; B2) instead.The extracted chart has missing or uncertain values
The extracted chart has missing or uncertain values
Chart extraction reconstructs values from pixels. Small labels, overlapping
marks, unlabeled ticks, and compressed images can reduce fidelity. Use the
highest-resolution source available and verify decision-critical values
against the original image.
Choose Between a Formula and a Menu Command
Use this custom function when one public chart image should produce one dataset at the formula location. Use the menu-driven table extraction guide when you need to read an image stored inside a cell, create a new worksheet, or process several source images in one run.Chart Parsing Benchmark
See how Unsiloed evaluates chart accuracy and point density.
Extract an In-Cell Image
Run a menu command that reads an image and writes a new worksheet.
Parsing
Review the parse workflow and the document structures it returns.
Google Sheets Integration
Connect a spreadsheet to Unsiloed and compare workflow patterns.