Parsing Excel Spreadsheets for LLM Applications
A spreadsheet grid is a canvas, not a schema. We show how Unsiloed turns a worksheet into a structure map of tables, headings, notes, and charts, and compare it with LlamaParse, Reducto, and Extend on information loss, segmentation accuracy, and token count.

Microsoft released Excel in 1985. Four decades later, organizations still use spreadsheets to calculate, plan, and report alongside databases and specialist planning systems. In BARC's 2024 planning survey, based on 1,272 respondents, 76% of companies used Excel for planning, budgeting, or forecasting, either alone or alongside other software.
That leaves a large amount of operational knowledge in workbooks: financial models, survey specifications, implementation plans, reference tables, and reporting dashboards. Making that knowledge available to large language model (LLM) applications requires more than converting cells to text. The parser must recover how the workbook is organized.
Why Spreadsheets Only Look Structured
A spreadsheet presents information in a grid, but the grid is a canvas rather than a schema. Authors use position, spacing, formatting, and merged cells to communicate relationships that are obvious to a person looking at the sheet but absent from an individual cell.
One worksheet might contain several unrelated tables beside one another, a heading that applies to the next 50 rows, notes beneath a table, and a chart floating over its source cells. Even apparently tabular data can use multi-level headers or blank rows as section boundaries. There is no guarantee that a row represents one record or that a column has one meaning from top to bottom.
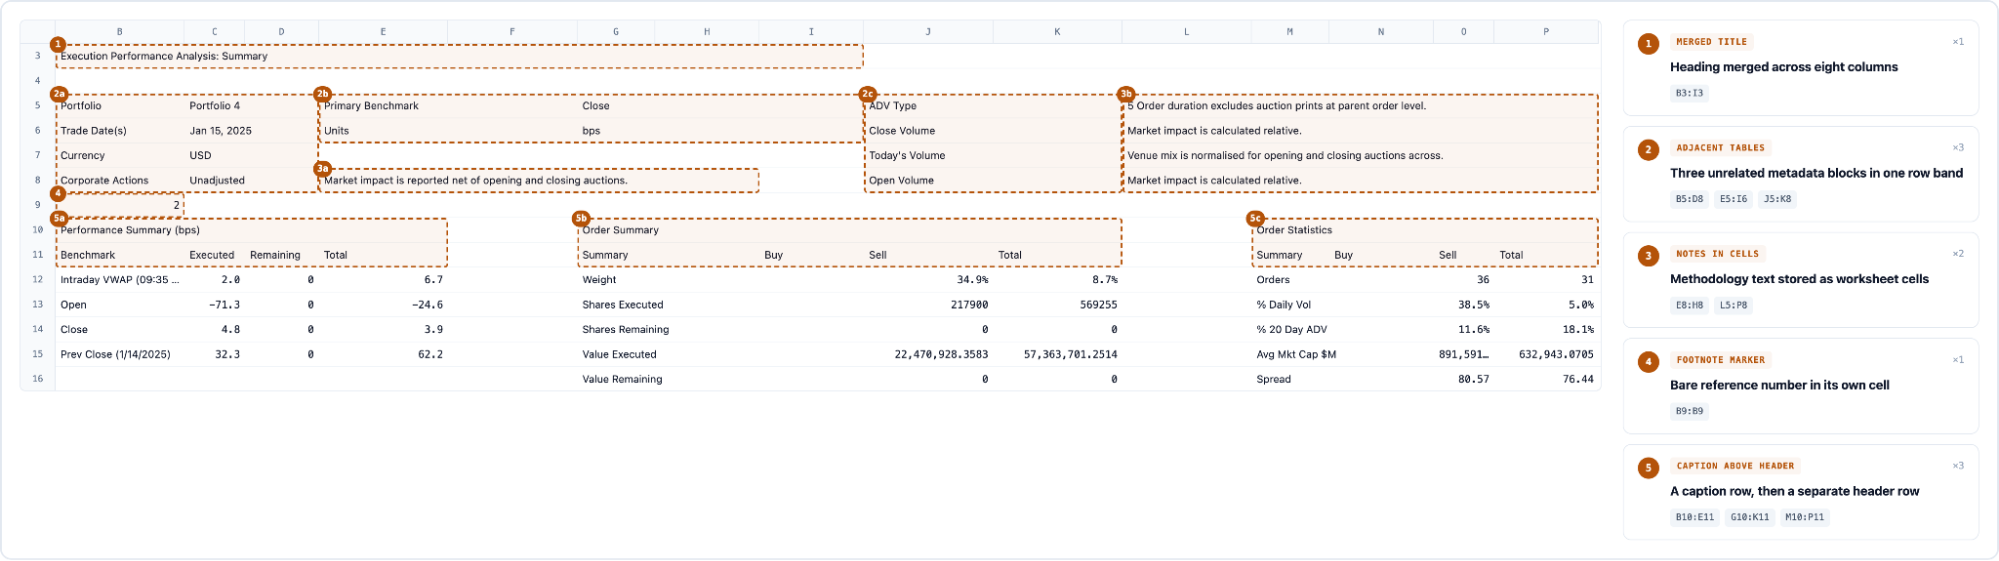
None of this is unusual, and none of it is recorded anywhere in the file as structure.
The problem compounds when a workbook exceeds an LLM's context window. Splitting the sheet into arbitrary row ranges keeps the file manageable, but it can separate a value from the heading that explains it. The value survives while its meaning disappears.

For retrieval-augmented generation (RAG), coding agents, and analytical workflows, the useful unit is therefore not a fixed number of cells. It is a coherent object such as a table with its complete headers, a title with the content it scopes, or a chart with its description and source data.
From a Workbook to a Structure Map
A useful Excel parser should identify the objects in a worksheet and preserve the relationships that give them meaning. Its output should include:
- Tables with their complete row and column headers
- Merged cells and multi-level header hierarchies
- Separate subtables within the same worksheet
- Titles and section headers that scope the content below them
- Charts, images, captions, and notes as distinct objects
- Source coordinates that link each object back to the workbook
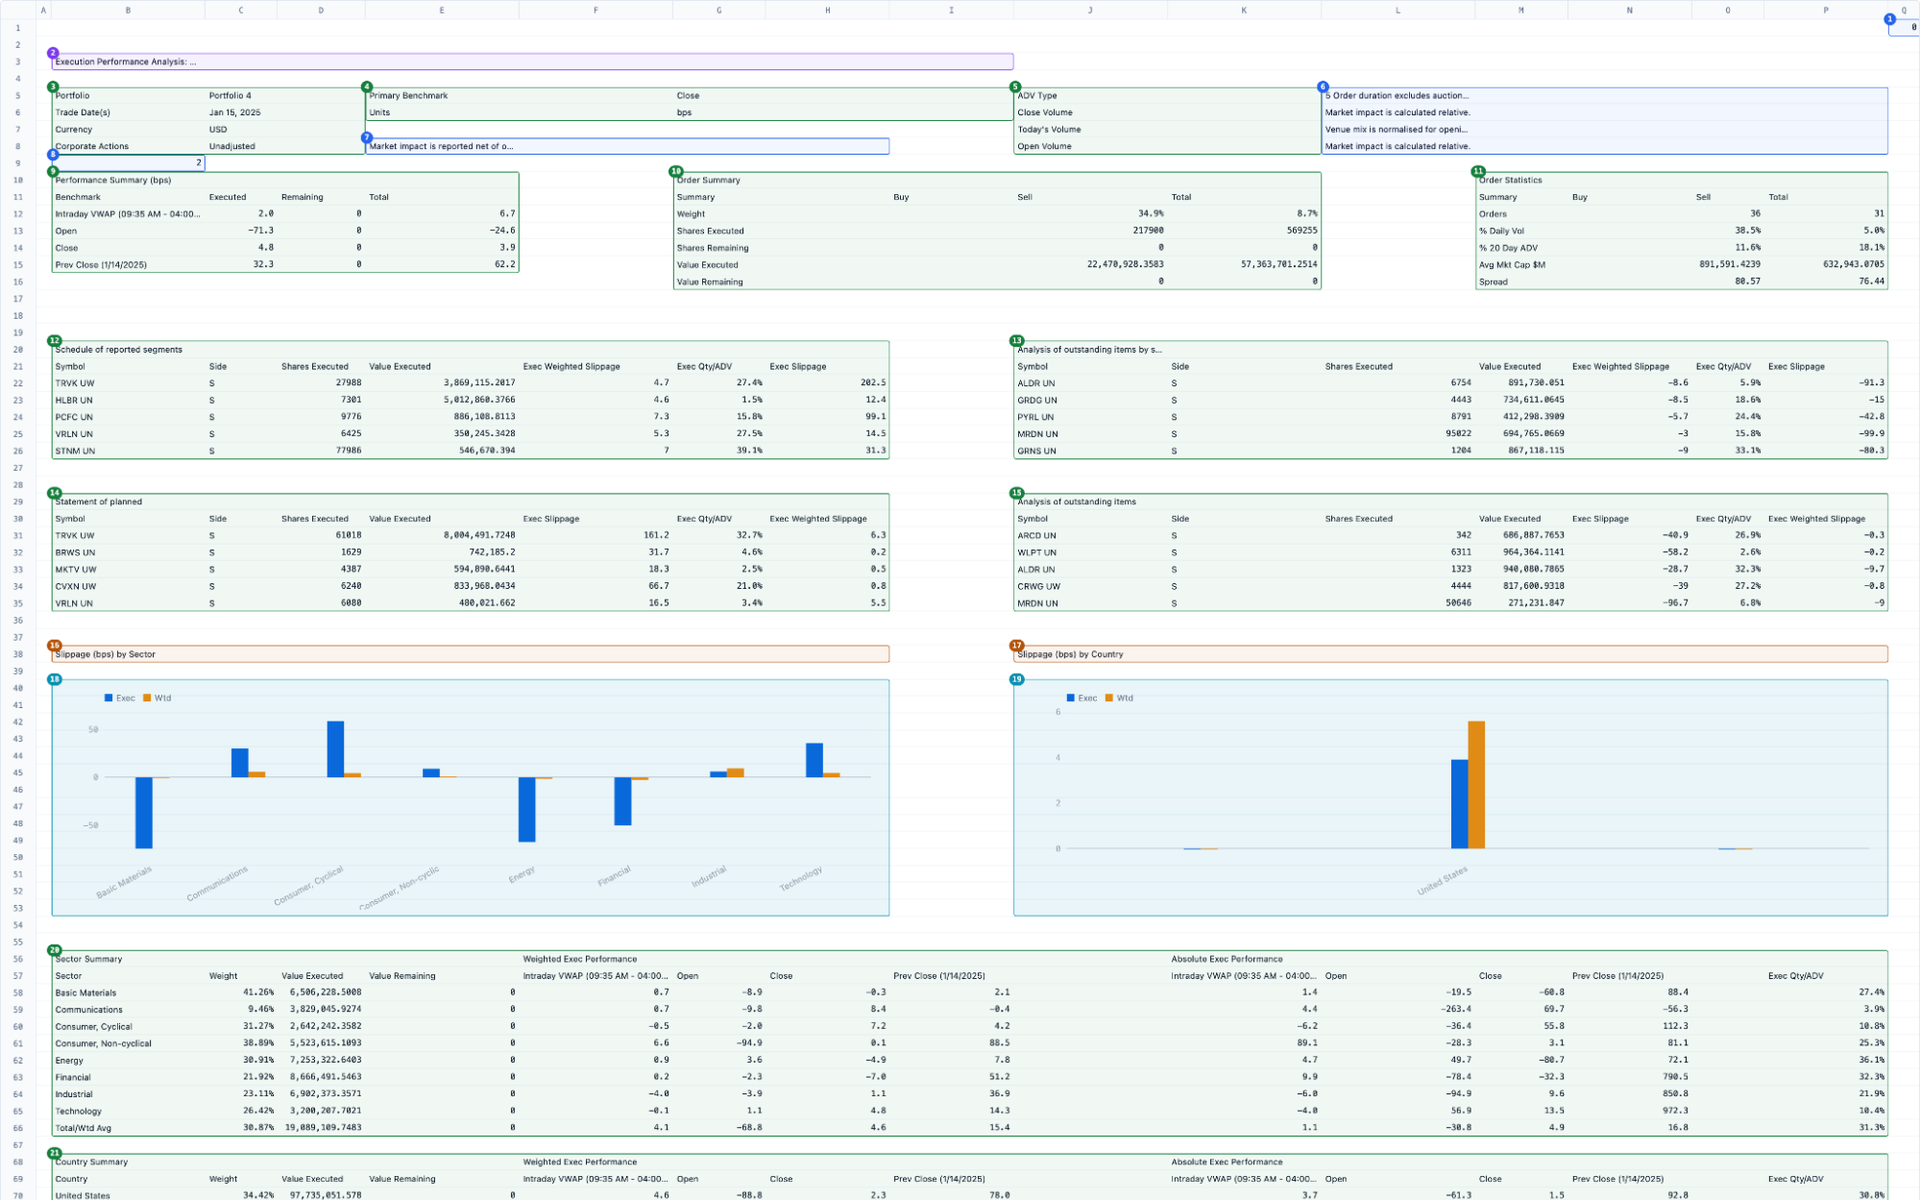
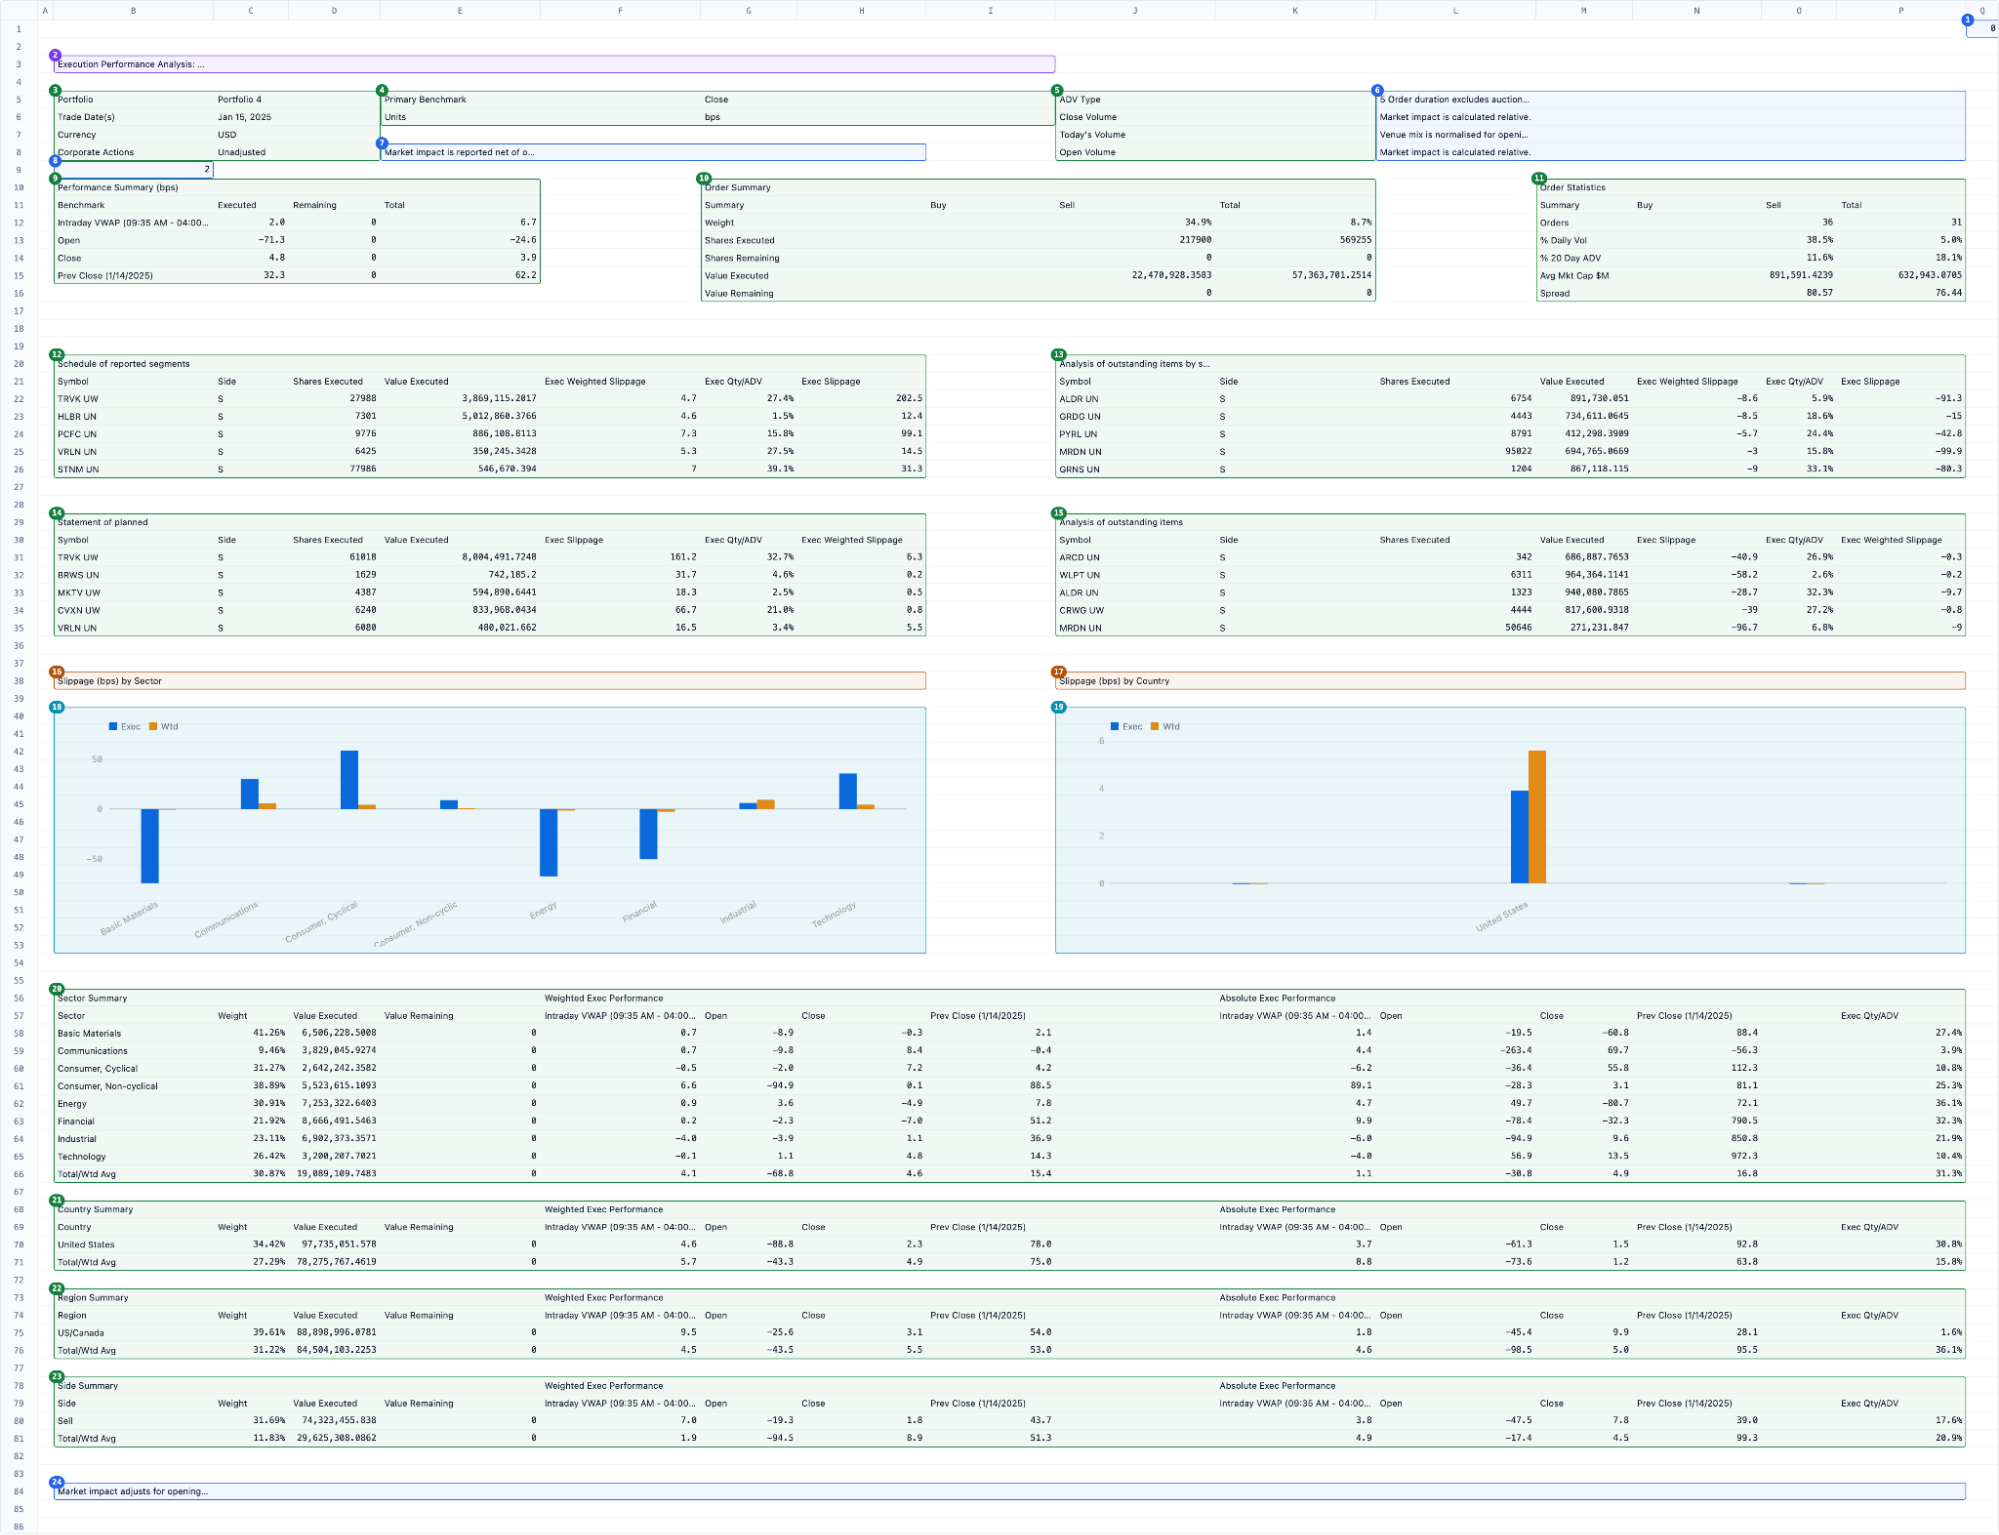
The worksheet from the previous section is a useful stress test at full size. It contains metadata, notes, report tables, section headings, and charts spread across 86 rows. Unsiloed identifies 24 separate regions instead of treating the entire grid as one table.
Returning to the top of the worksheet, the parser resolves the same 14 rows into one title, three metadata tables, three text notes, and three report tables. Each report table starts with its caption and retains the headers required to interpret its values.
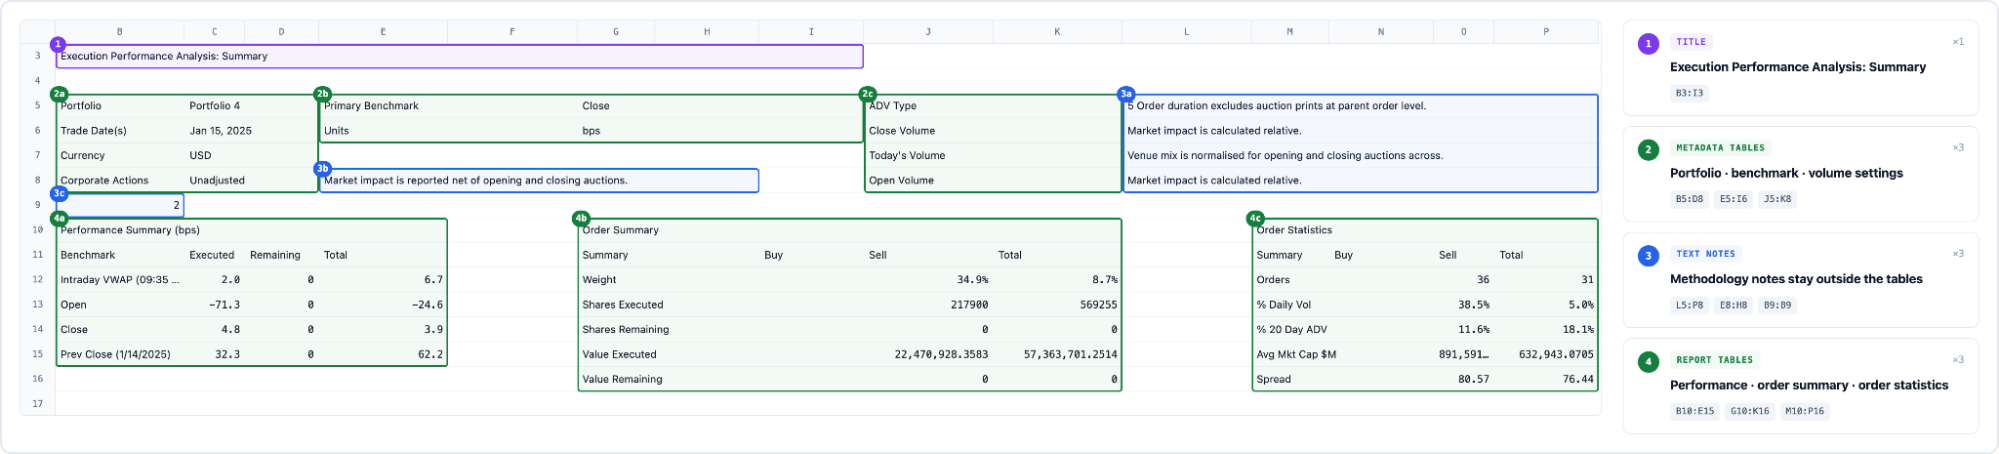
The result is a structure map rather than one block of raw worksheet content. Every segment carries its type and the worksheet region it came from. The region is a cell rectangle: left and top give the first column and row, width and height give the extent, and page_width and page_height give the size of the sheet itself.
{
  "chunks": [{
    "segments": [
      {
        "segment_type": "Title",
        "content": "Execution Performance Analysis: Summary",
        "bbox": { "left": 2, "top": 3, "width": 8, "height": 1 },
        "page_width": 17,
        "page_height": 84
      },
      {
        "segment_type": "Table",
        "content": "Benchmark\tExecuted\tRemaining\tTotal\nIntraday VWAP (09:35 AM - 04:00 PM)\t2.0\t0.0\t6.7\n...",
        "bbox": { "left": 2, "top": 11, "width": 4, "height": 5 }
      },
      {
        "segment_type": "SectionHeader",
        "content": "Slippage (bps) by Country",
        "bbox": { "left": 10, "top": 38, "width": 7, "height": 1 }
      },
      {
        "segment_type": "Picture",
        "content": "The provided image displays a clustered bar chart comparing two performance metrics across five distinct categories...",
        "bbox": { "left": 10, "top": 40, "width": 7, "height": 14 }
      }
    ]
  }]
}
Those coordinates are what make the hierarchy recoverable. This sheet carries two section headings side by side, each above its own chart. The SectionHeader at row 38 and the Picture at row 40 occupy the same seven columns, so an agent can determine that this chart belongs to Slippage (bps) by Country rather than to the heading beside it.
A downstream agent can therefore inspect the map before retrieving anything. An agent answering a question about executed shares can select the Order Summary table alone, without loading the performance tables, notes, charts, and unused cells into its context. The same boundaries make generated code safer, because the agent can operate on a region with known headers and known extent instead of guessing ranges in a grid.
Qualitative Differences Between Excel Parsers
The practical difference between parsers shows up in the objects they return. Two failure modes matter most: a large worksheet flattened into one undifferentiated table, and a dense region returned at the wrong granularity.
Large Worksheets Collapse Into One Table
This semiconductor financial model spans 419 rows and 96 columns. It holds separate sections for revenue by geography, revenue by product, the demand drivers behind them, cash flow, the balance sheet, and valuation, each with its own headers and its own units.
LlamaParse returns the sheet as a single Markdown table running to 355 lines. The section names survive, but only as ordinary rows: REVENUE BY PRODUCT becomes a table row with empty cells after it, indistinguishable from a data row. Nothing marks where one section ends. Unsiloed returns each section heading as a SectionHeader and each block of figures as its own Table.
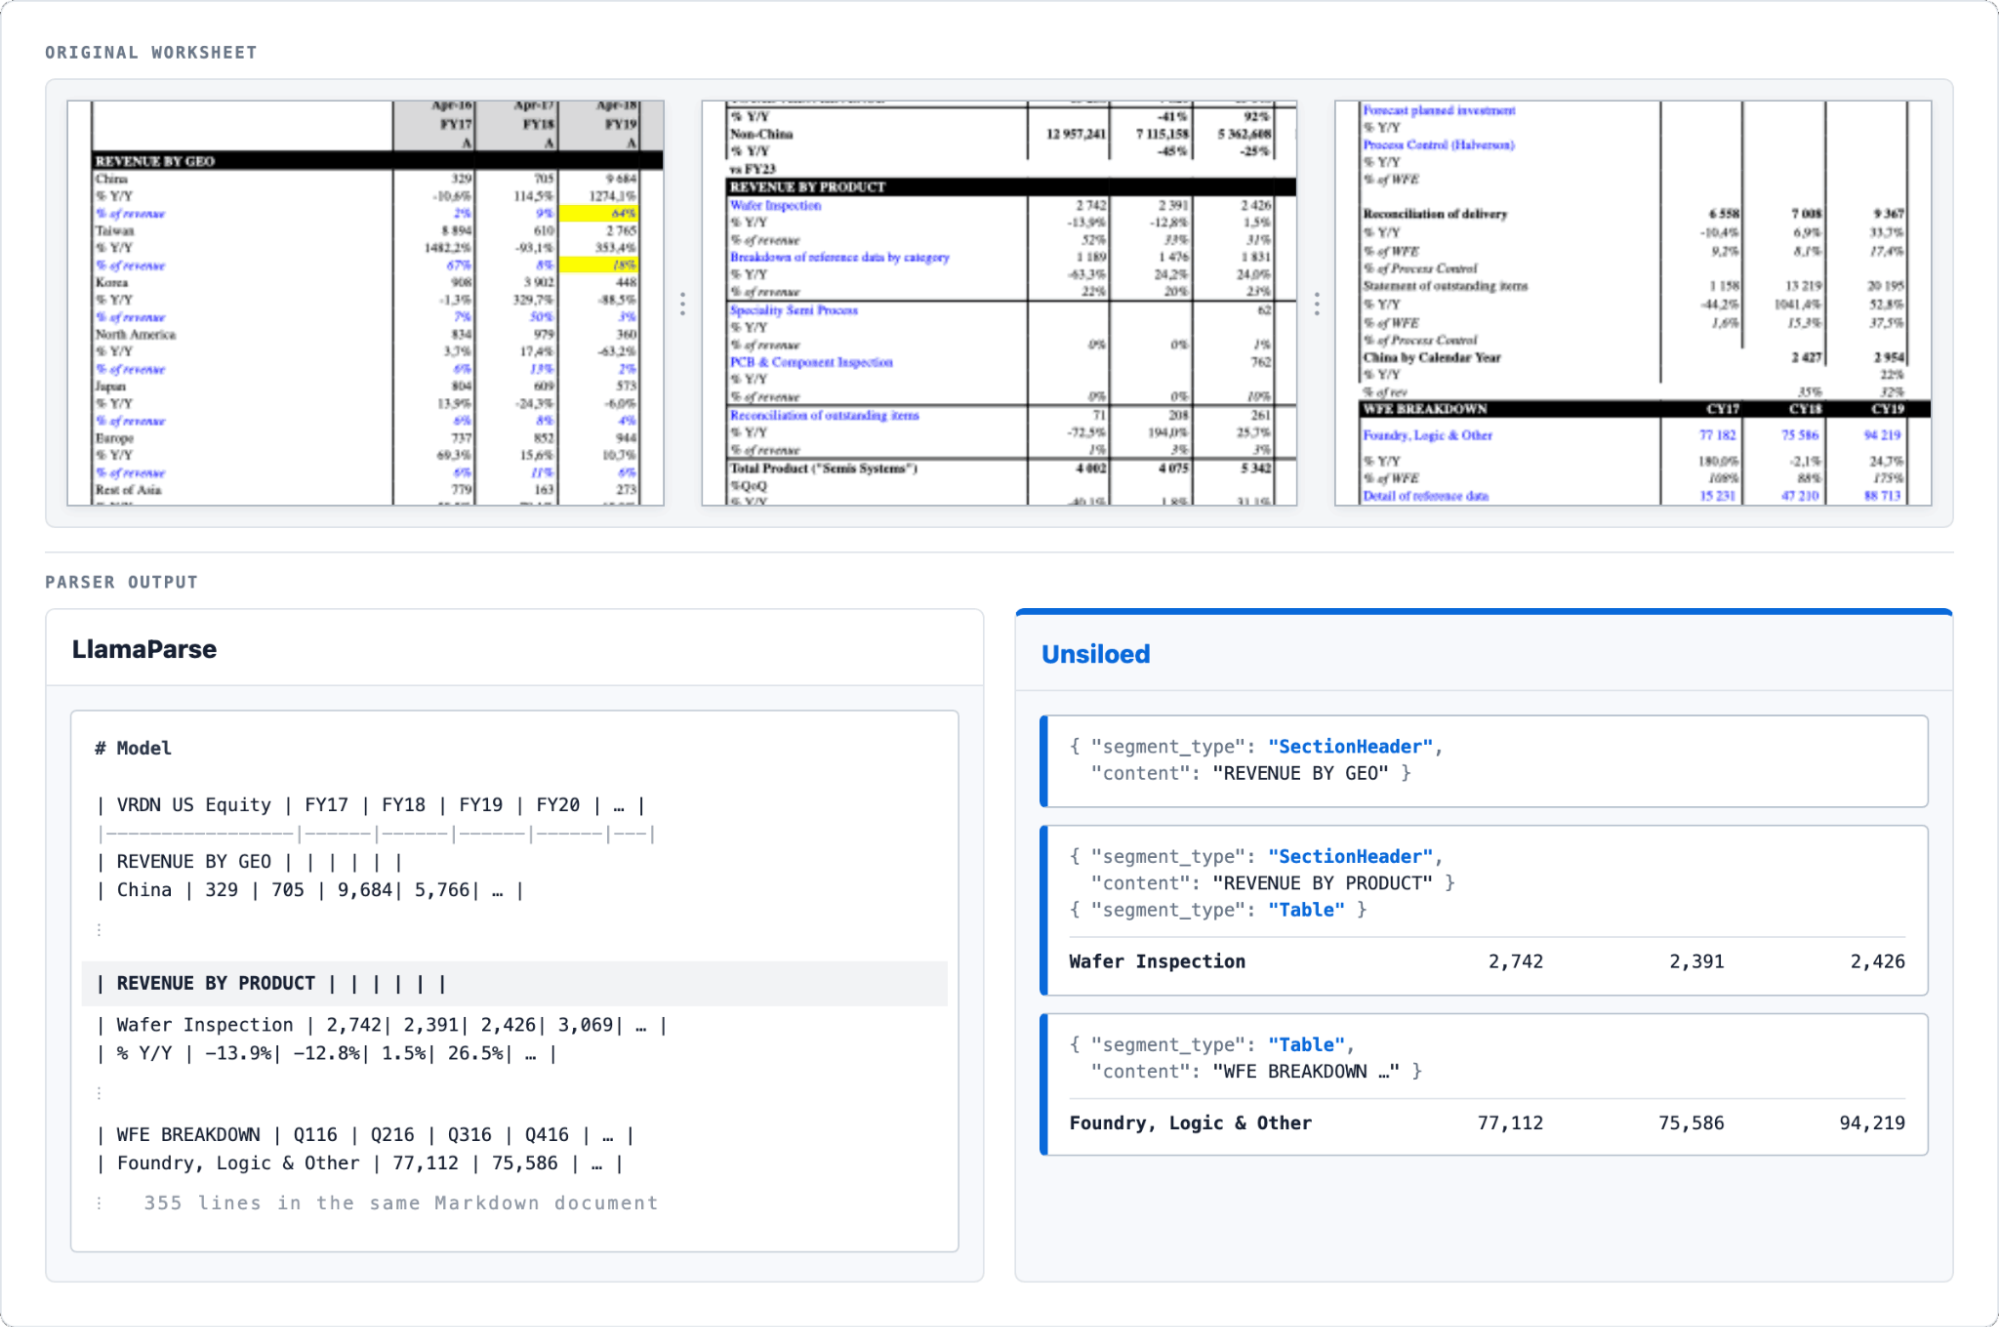
The consequence is retrieval. Selecting the revenue-by-product figures from the LlamaParse output means selecting a row range out of one 355-line table and hoping the boundaries are right. Selecting them from the Unsiloed output means selecting one object.
Adjacent Sections Lose Their Boundaries
Granularity fails in the other direction on smaller, denser regions. This data transfer specification defines three separate request blocks in 21 rows: an individual record transfer, a batch transfer over SFTP, and a periodic reconciliation. Each repeats the same field names, including Authentication Method and Authentication Credentials.
Extend returns all three blocks inside one table, then returns a second table that repeats several of the same fields under the sheet's overall heading. Unsiloed returns each block as its own object, introduced by the SectionHeader that names it.
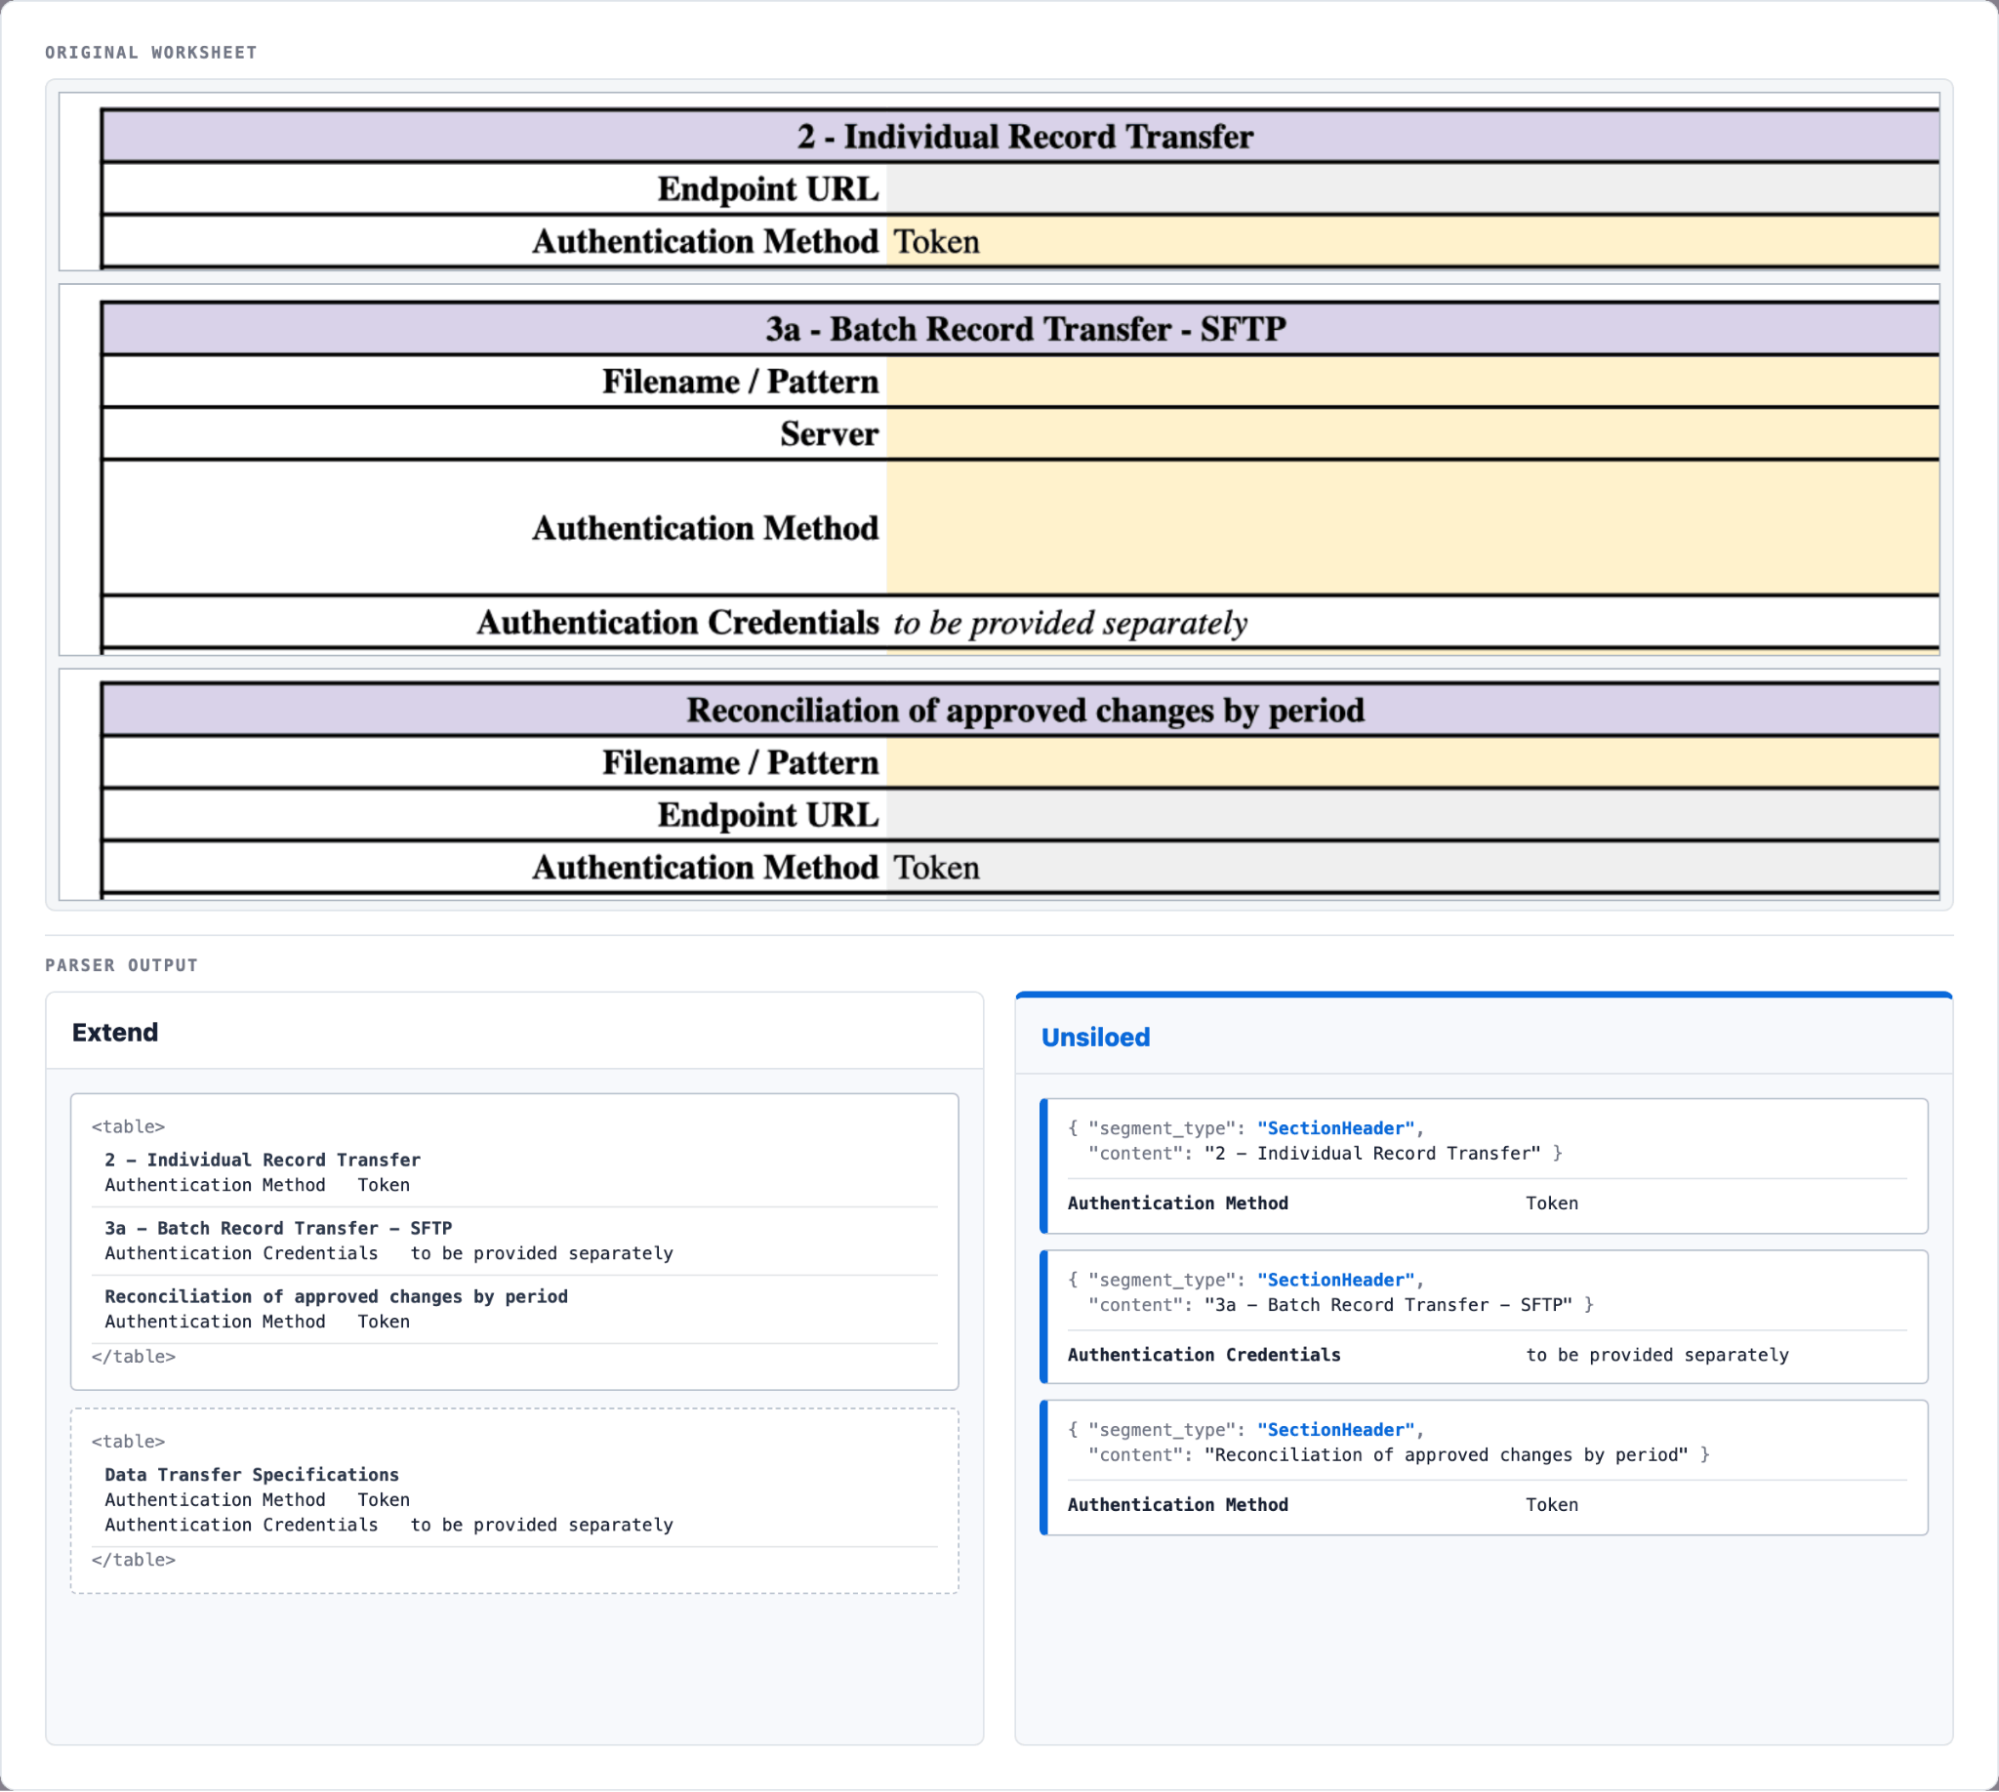
Because the field names repeat, the merged output is ambiguous in a way the source is not. A query for the SFTP authentication method matches text from all three blocks, and nothing in the returned segment says which block a given value came from.
Quantitative Evaluation of Excel Parsing
Qualitative examples show the consequences of a parsing decision. Quantitative results show whether those decisions hold across a test set. We compared Unsiloed with LlamaParse, Reducto, and Extend using three metrics: information loss, segmentation accuracy, and token count.
Information Loss Shows the Baseline
Information loss measures whether source content disappears from the parser's response. It is a basic completeness check, not a measure of parse quality. A script could walk the worksheet XML, emit every stored cell value, and score 0% text loss without identifying a single table, heading, note, or relationship.
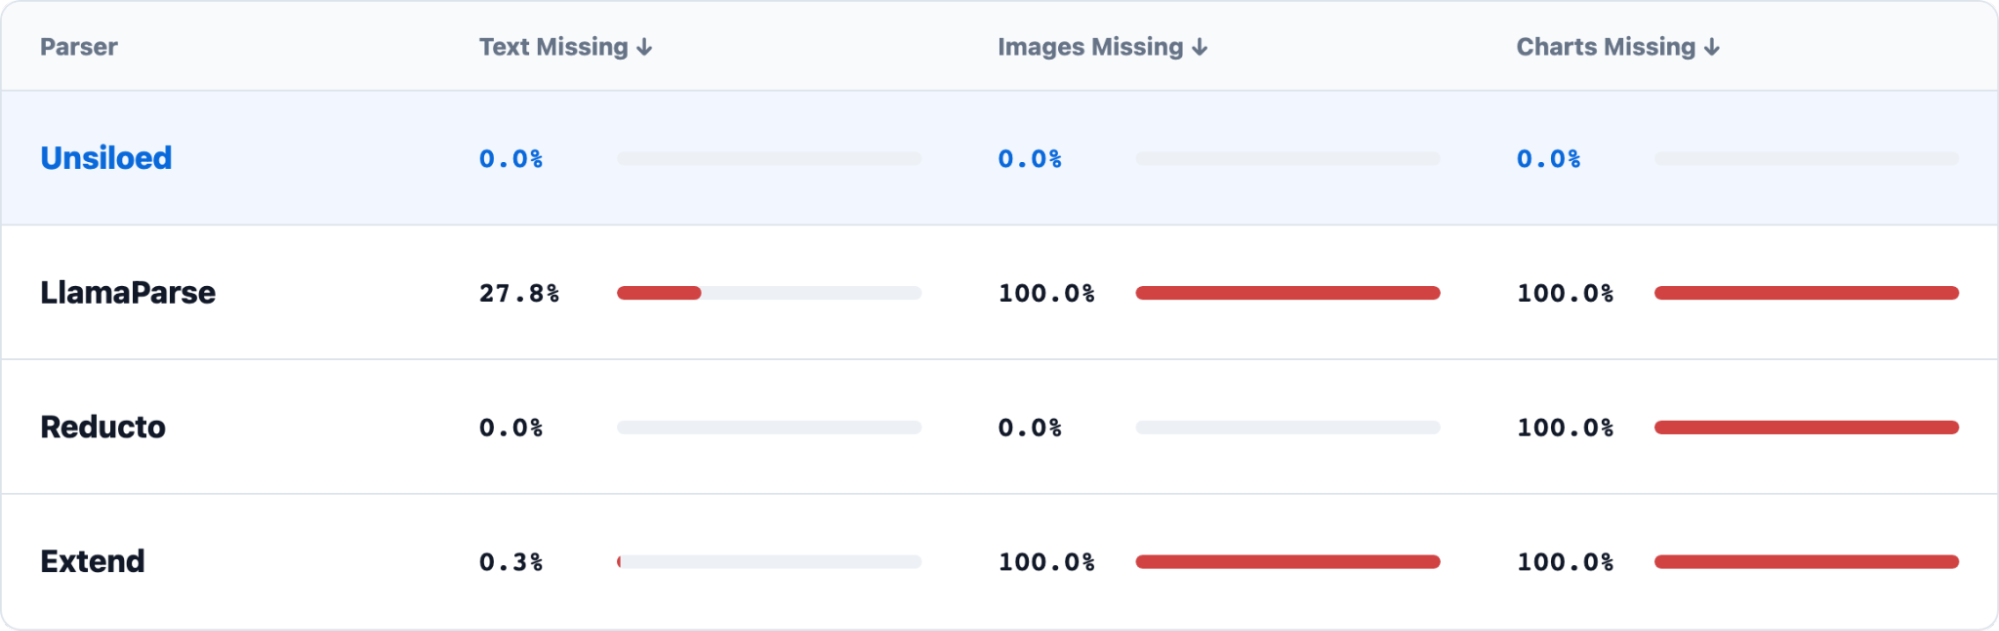
Read this as a screening check. A low loss score establishes that content reached the output; it does not say whether the relationships between that content survived. The financial model above makes the distinction concrete: a parser can retain every value in the sheet and still return the whole thing as one table.
The exception is content that is not stored in cells at all. An .xlsx file stores a chart as an object pointing at data ranges elsewhere in the workbook, floating over the grid rather than occupying a range, so a parser that reads cells never reaches it. The worksheet below contains a chart and the table supplying its data. Reducto returns the source table but no chart object. Unsiloed returns the same table and a separate Picture segment that describes the chart.
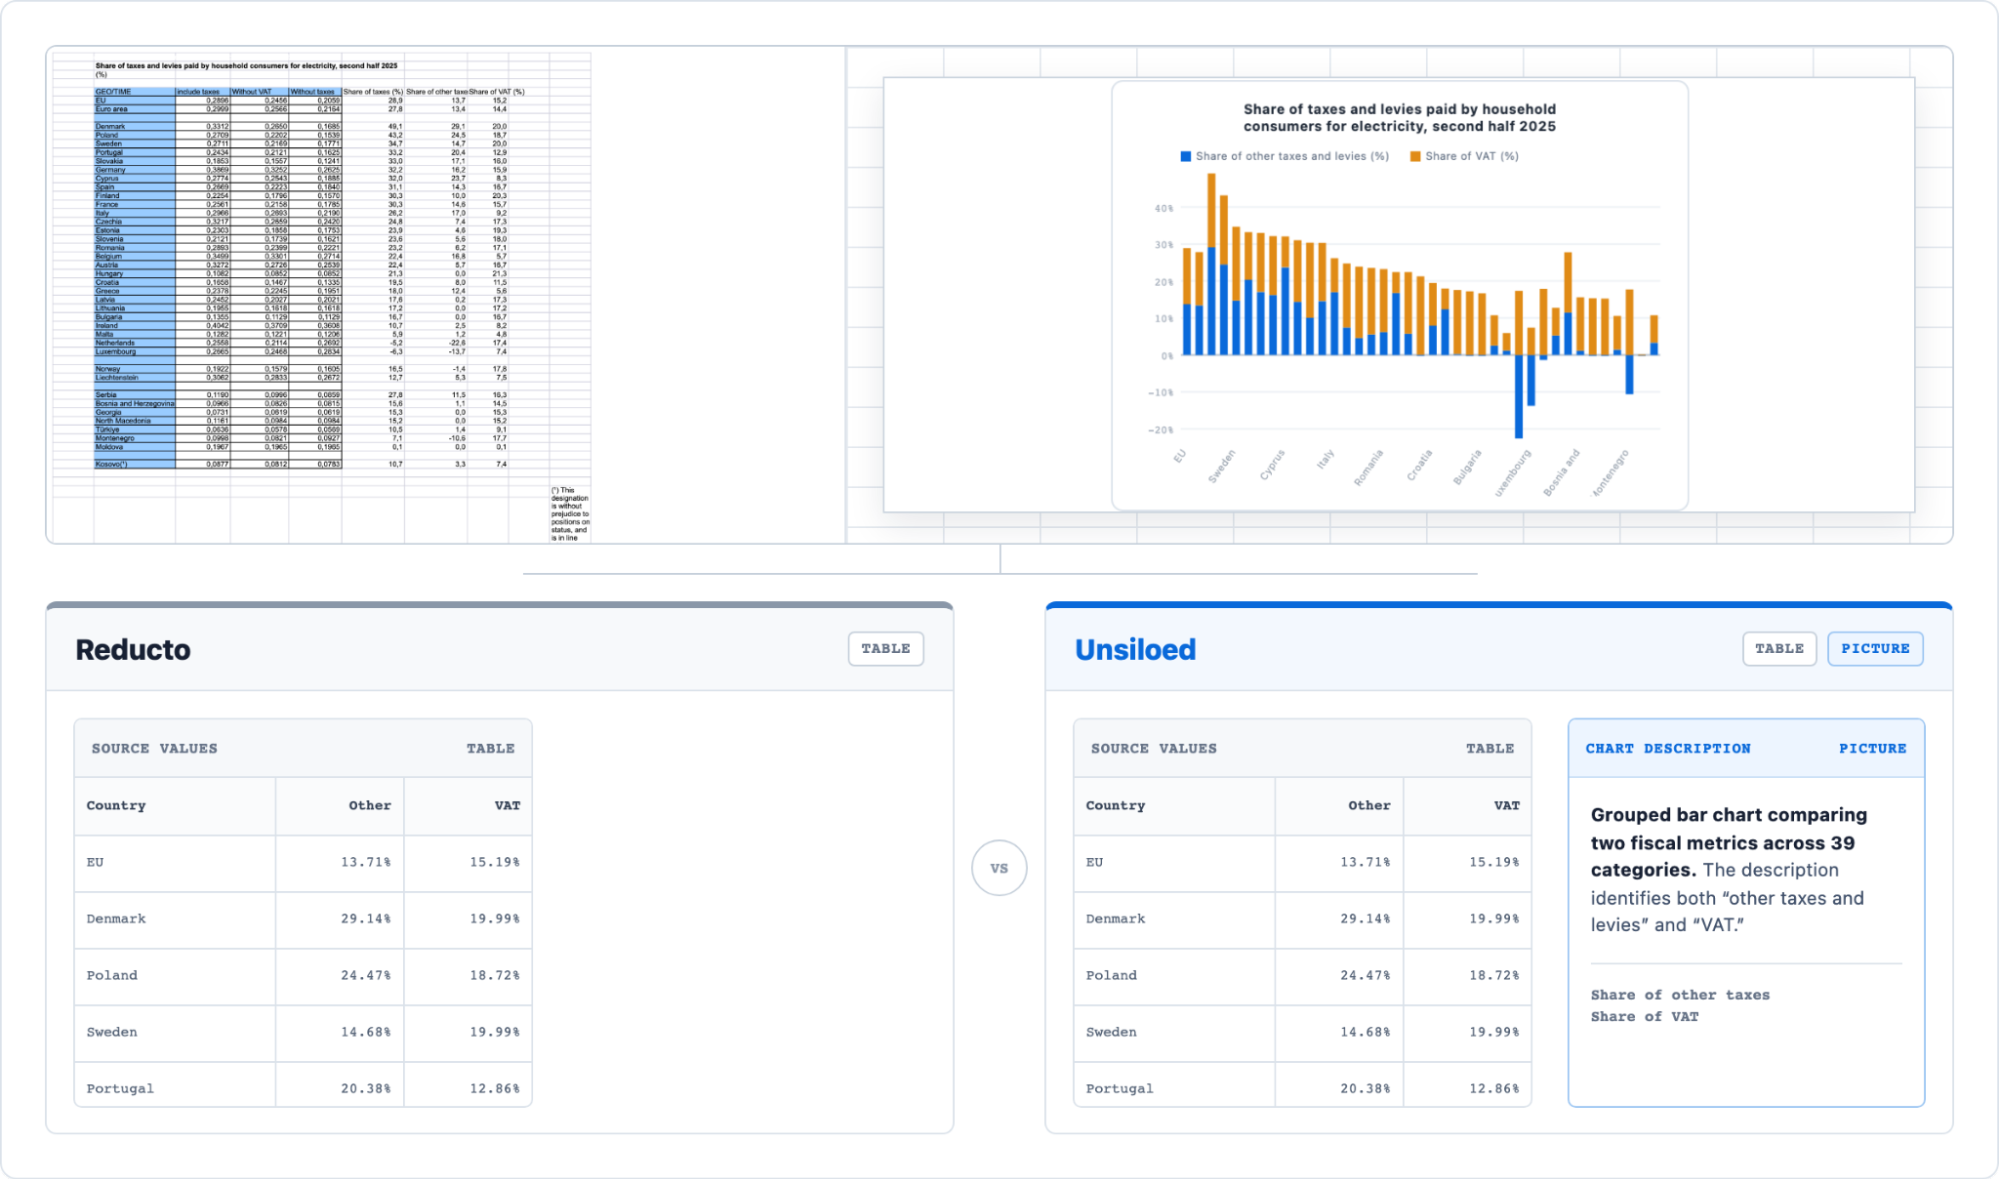
Both parsers retain the plotted numbers. Only one records that the workbook's author presented those numbers as a chart, which is why charts are the part of this metric worth reading closely.
Segmentation Accuracy Measures Actual Parse Quality
Segmentation accuracy asks whether the parser reconstructed the correct tables, text blocks, images, charts, and boundaries between them. These boundaries show whether a retrieved segment carries enough context to be useful.
We scored parser outputs against manually annotated ground truth for 60 difficult worksheets. The worksheets include merged headers, adjacent tables, nested subtables, notes, images, and embedded charts.
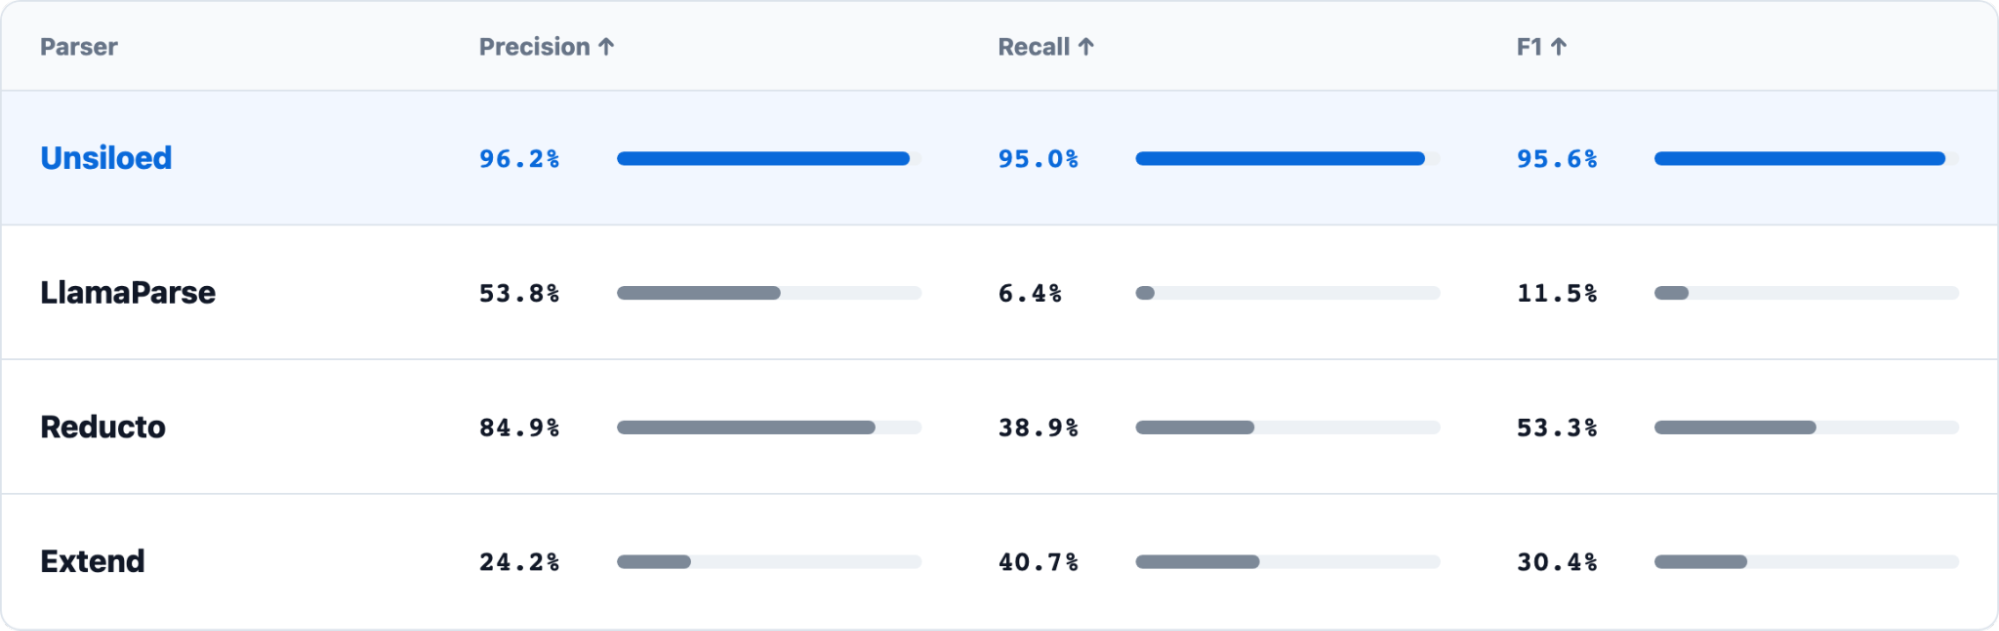
These scores distinguish between preserving content and reconstructing its structure. Precision measures how often the returned segments are correct. Recall measures how many of the expected segments the parser finds. F1 combines the two into one score, so a high F1 means the parser finds most objects without adding many incorrect ones.
Token Count Measures the Cost of Using the Result
An LLM application pays for the representation it places in context, not for the size of the original .xlsx file. When a parser returns a flattened Markdown grid, it repeats headers and empty cells across rows. When it cannot expose the workbook's structure separately, a downstream agent may need to load the entire raw output just to discover which part is relevant.
A structure map lets the agent understand the worksheet's hierarchy first, then retrieve only the objects needed for the task. That reduces both input cost and the amount of irrelevant material the model must reason over.
For each worksheet, we serialized the complete response from every parser and counted it with the same tokenizer. We applied this method to a broader corpus of 780 worksheets.
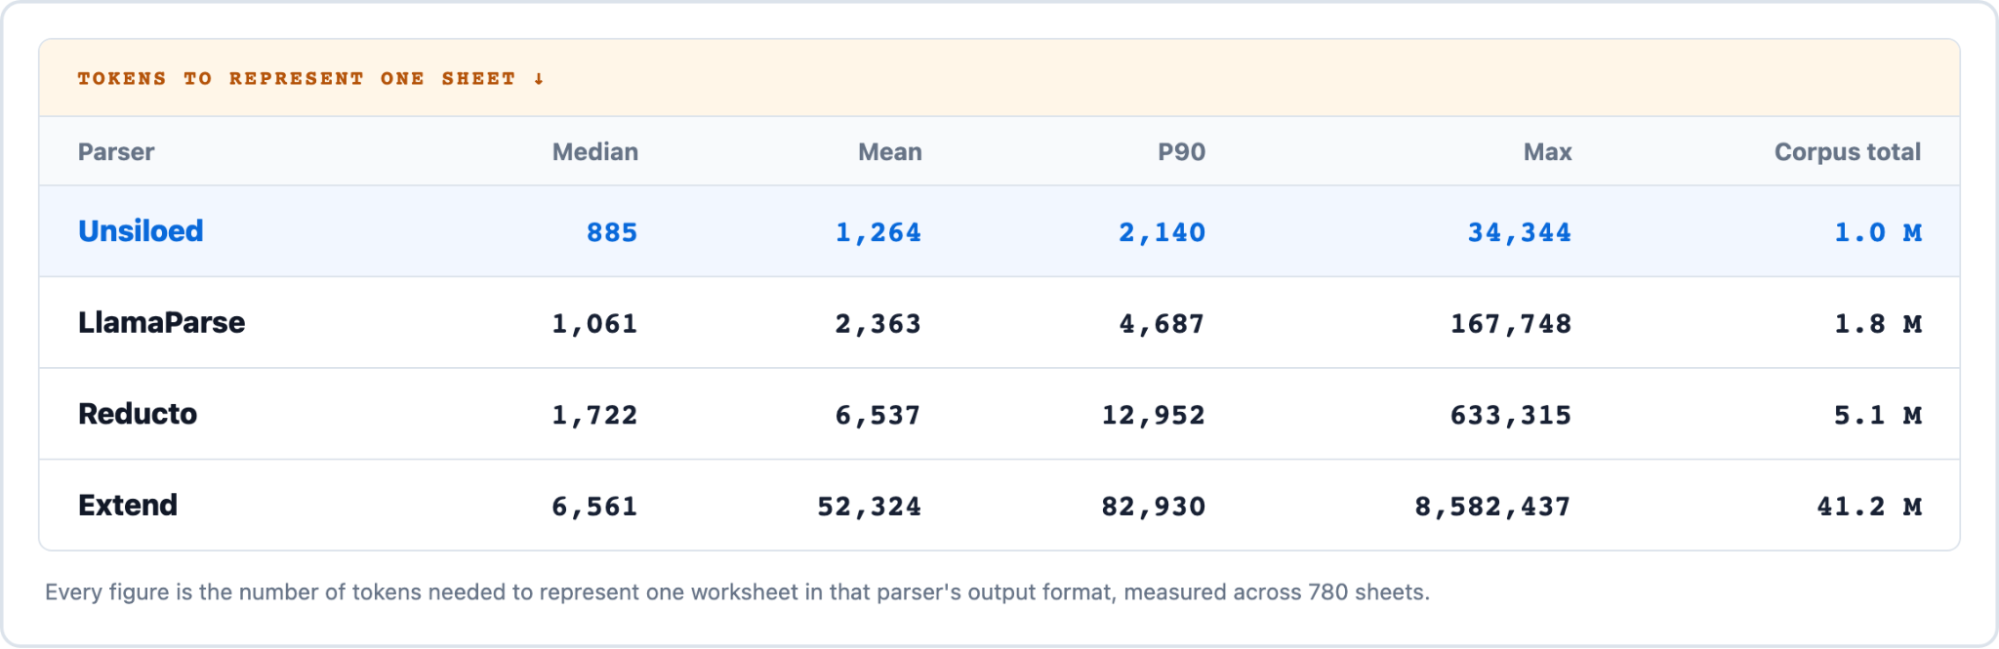
The upper end of the distribution matters most for production systems. Flattened representations can expand dramatically on complex worksheets, turning an otherwise usable document into an impractical prompt and increasing the cost of corpus-wide indexing.
These savings do not come from dropping content. Unsiloed provides a map of the worksheet's tables, headings, and hierarchy instead of presenting downstream agents with undifferentiated raw content. An agent can understand how the sheet is organized from this map, then retrieve only the objects it needs without loading the full worksheet into context.
More Excel Parsing Examples
The same structural differences appear across financial models, dashboards, and operational specifications.
Independent Tables Become One Wide Table
The valuation worksheet below places a BASE/BULL/BEAR scenario analysis beside an unrelated lookup table of annualized figures. LlamaParse returns the worksheet as one wide Markdown table, aligning both sections by worksheet row, so scenario assumptions and unrelated lookup values appear in the same output rows. Unsiloed returns the two sections as separate objects.
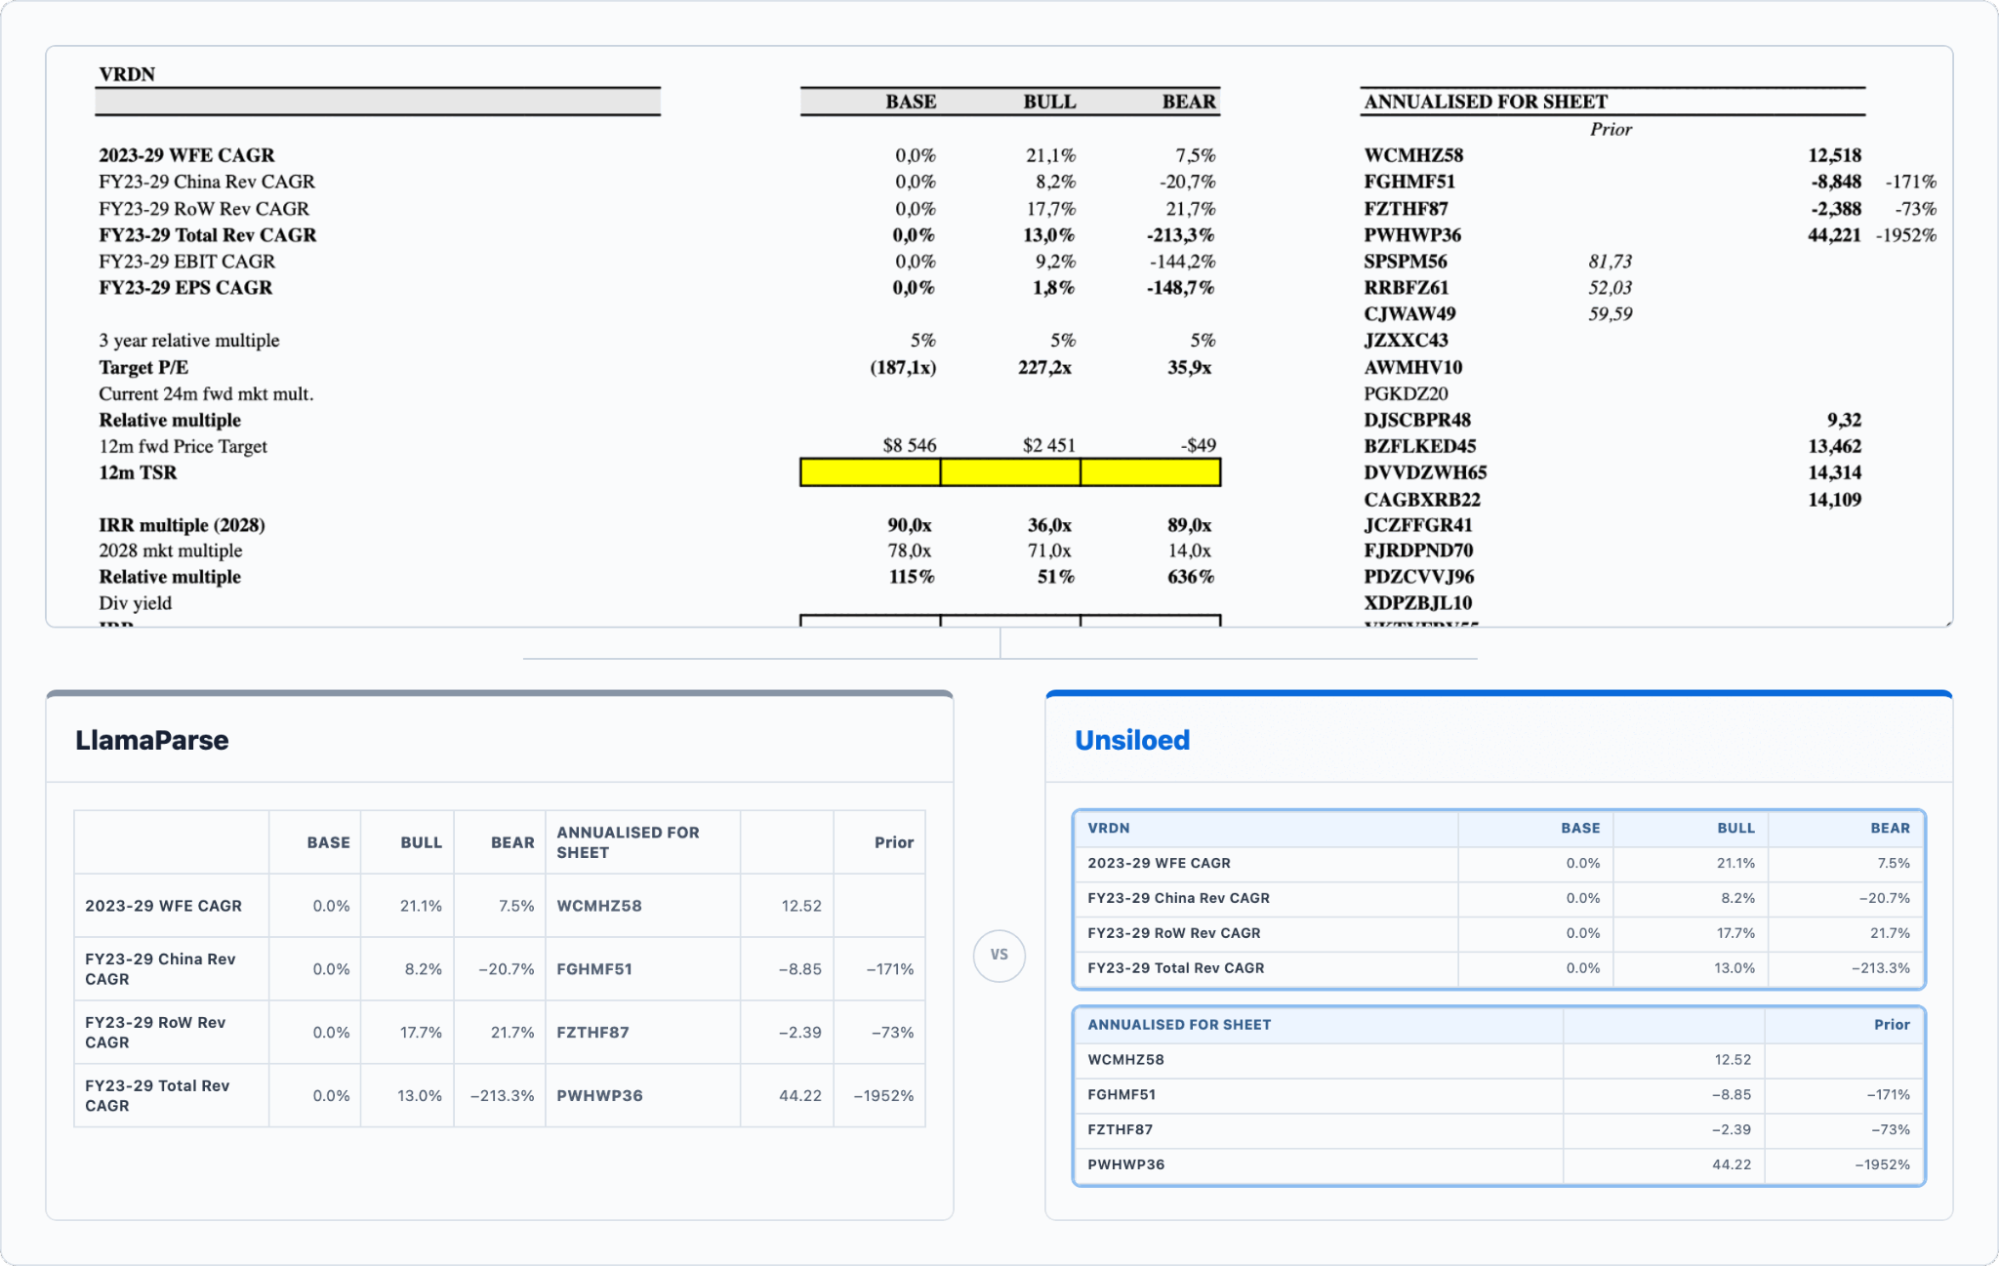
Both outputs contain the text shown in the source. What the joined output removes is the boundary that tells an LLM which figures belong together.
Three Adjacent Summaries Become One Table
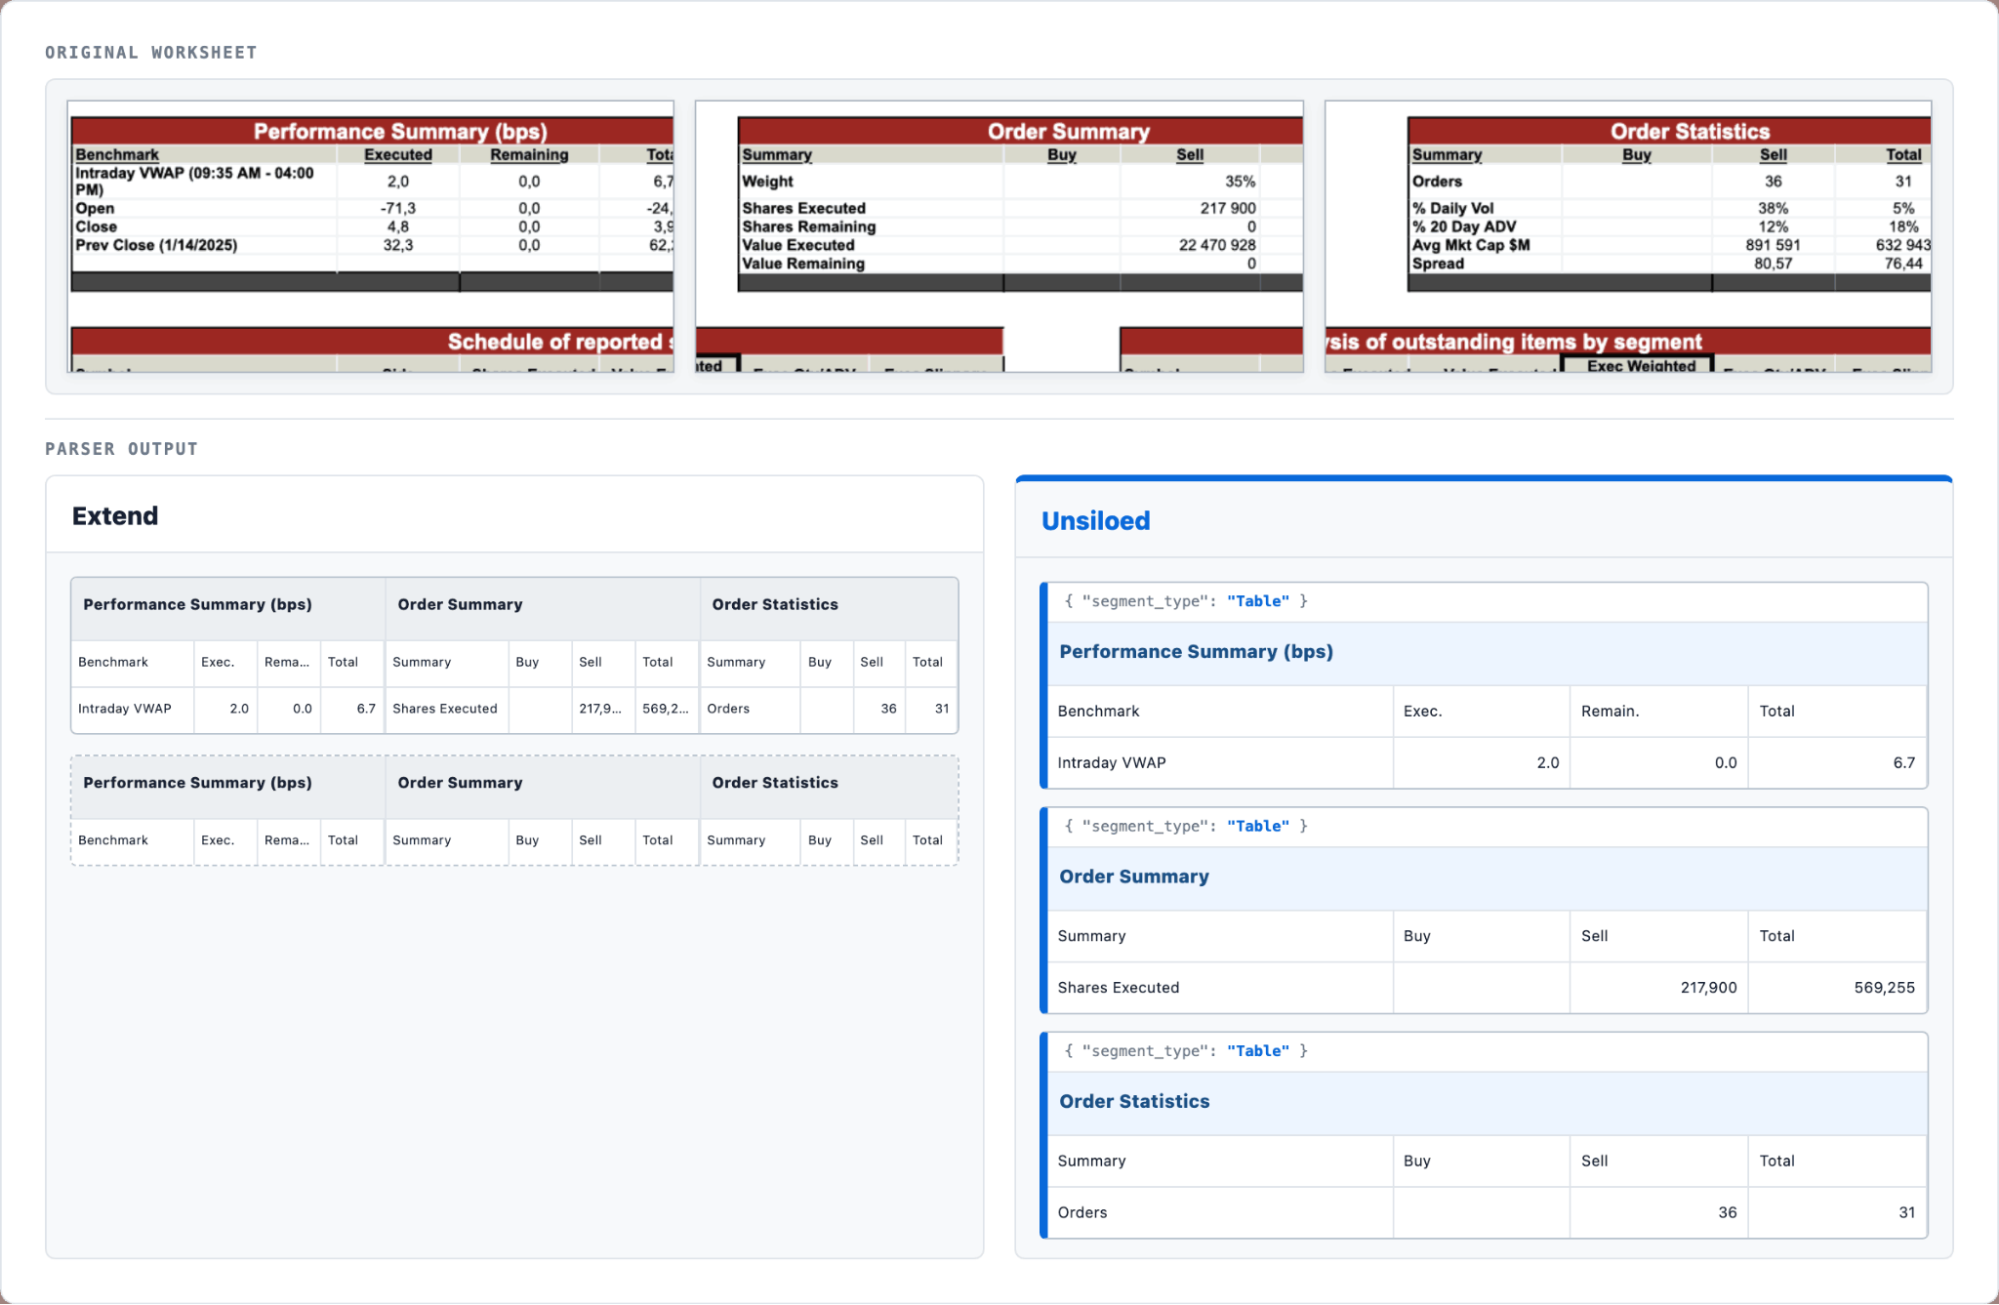
An execution report places performance, order, and order-statistics summaries beside one another. Extend merges the three summaries into one table and returns that table twice; Unsiloed returns three separate table objects.
Survey Blocks Lose Their Hierarchy
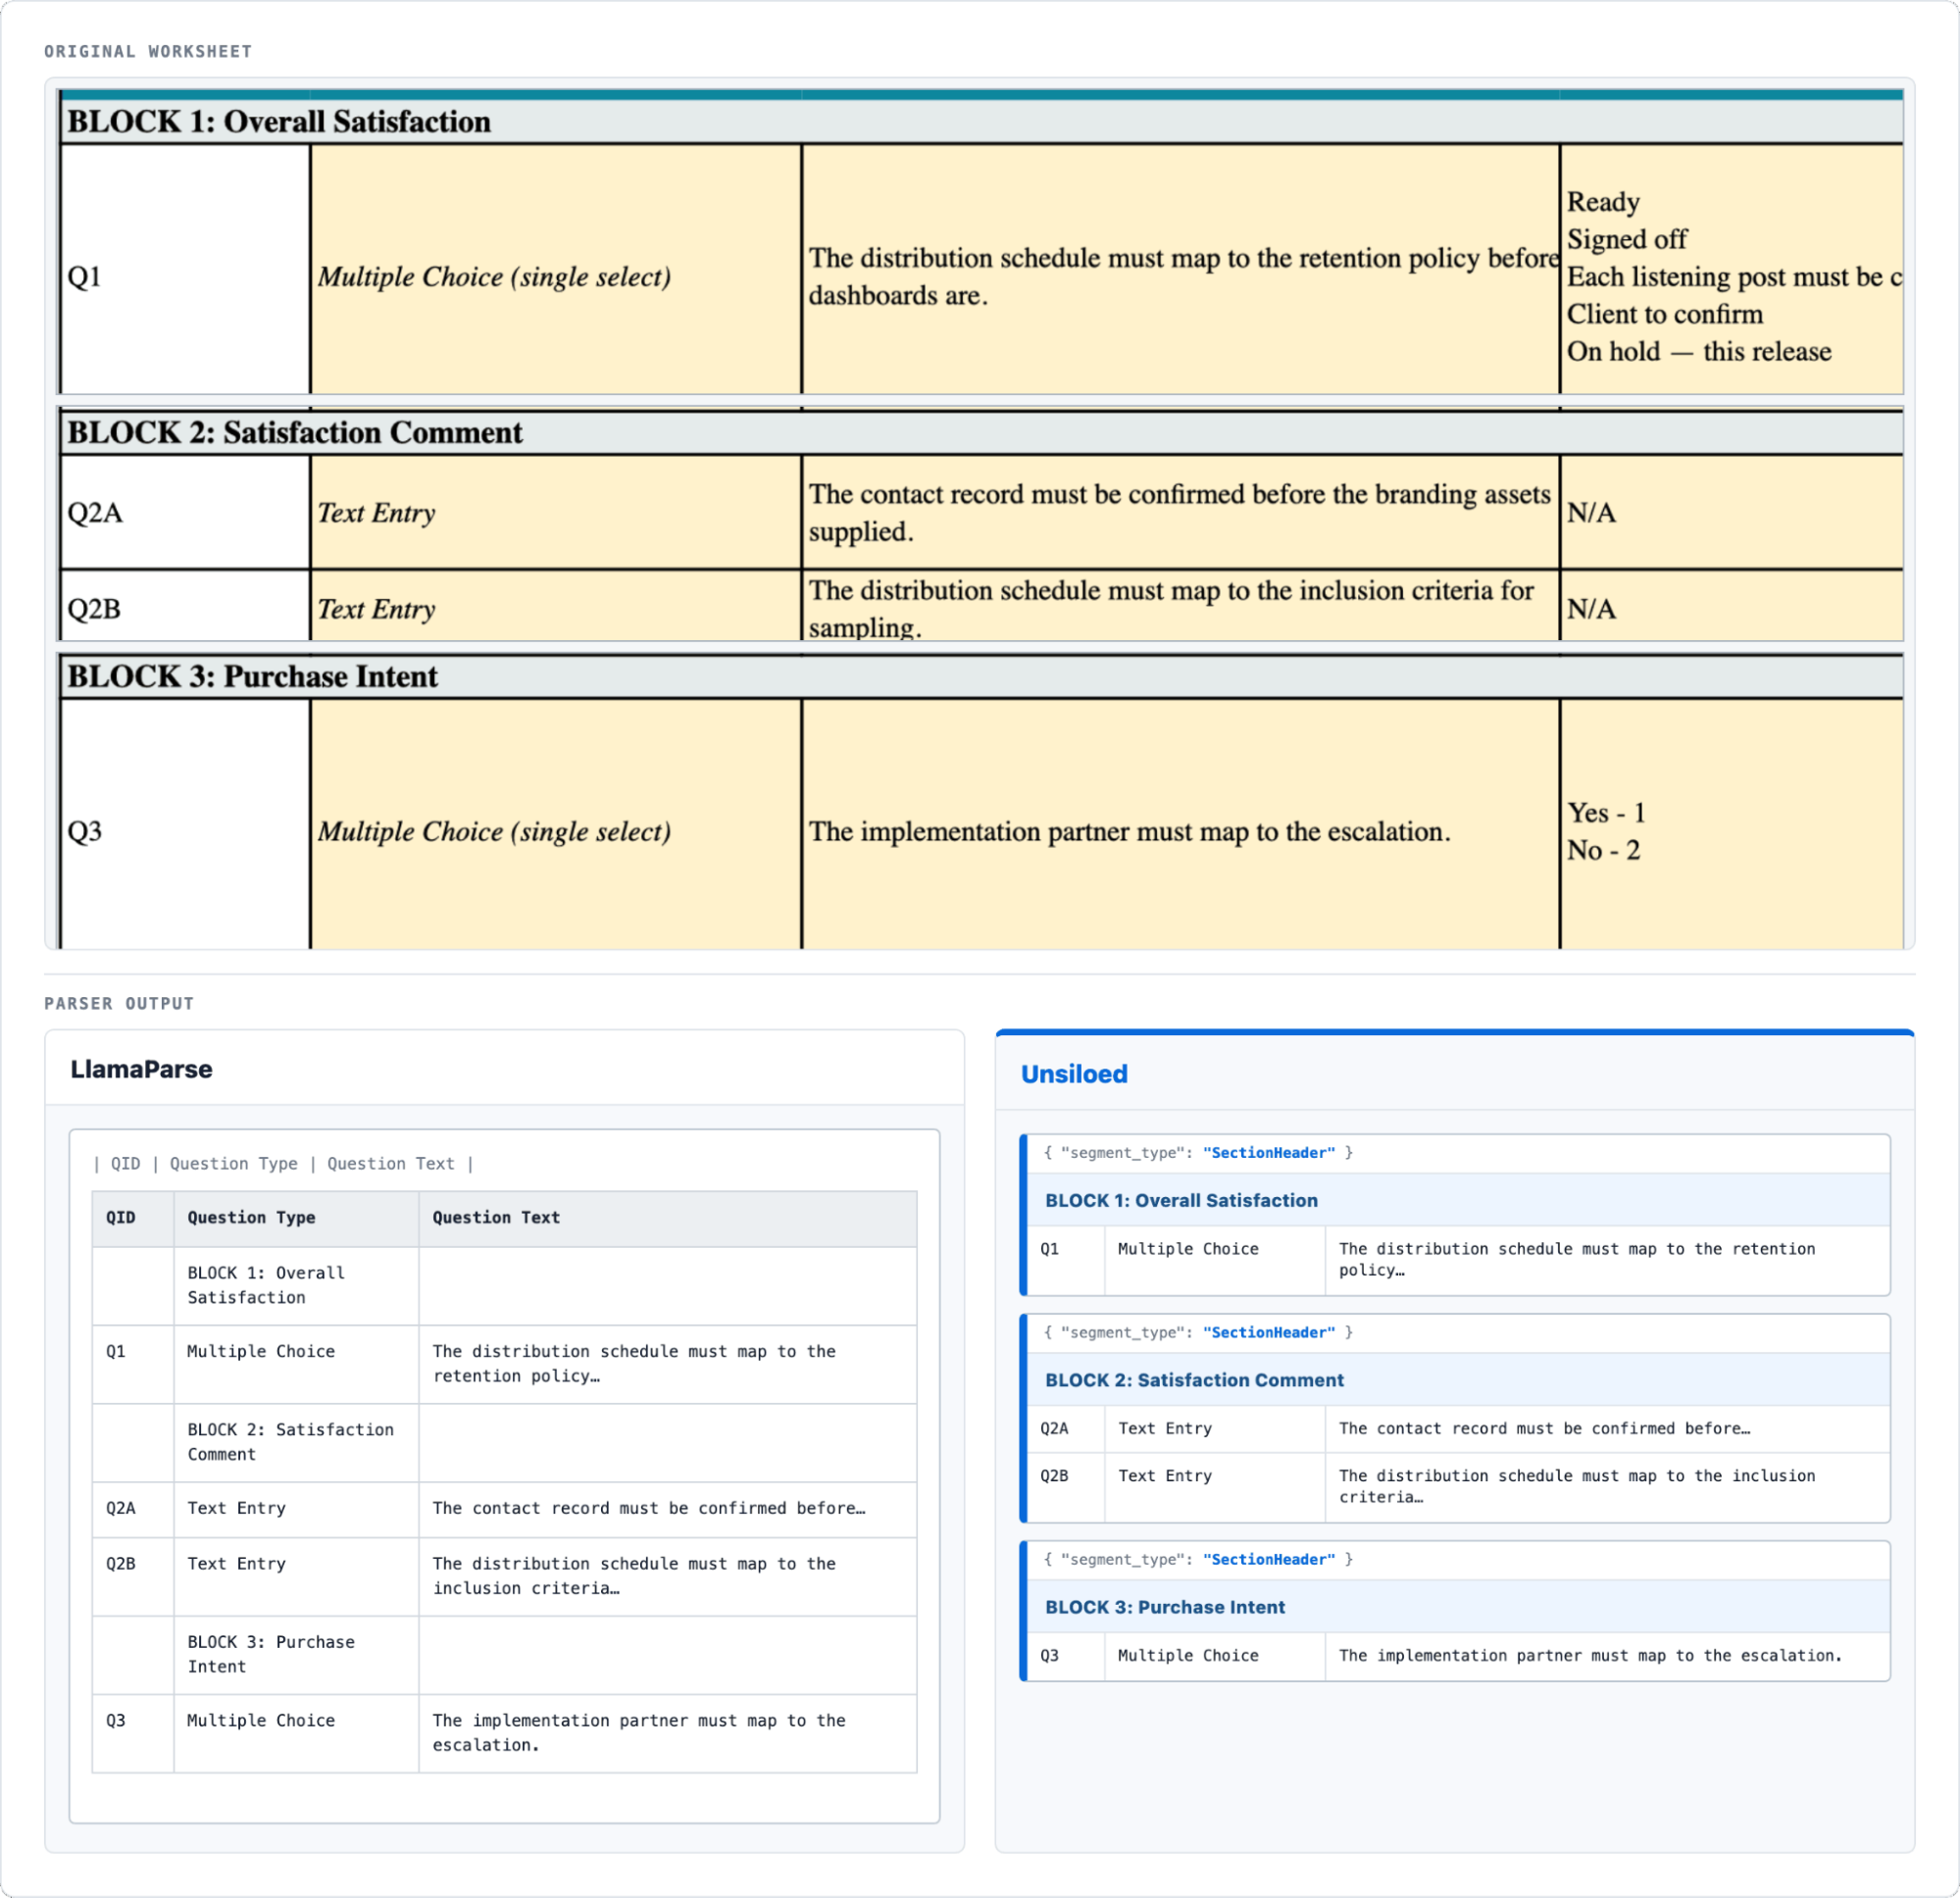
This survey specification groups related questions under named blocks. In LlamaParse, selecting one block still selects the entire flat table; Unsiloed keeps the heading and its questions inside one retrievable object.
The comparative analysis of more than 30 spreadsheets includes further examples with merged headers, subtables, footnotes, and mixed content.