Charts, Plots, and Figures: Getting Visual Data APIs Skip (July 2026)
Your parser can return clean text, neat chunks, and complete metadata while still missing the most important value on the page: the number inside a chart. That is where document extraction pipelines quietly fail. A chart is more than an image in the middle of a report. It may contain the revenue tre

Your parser can return clean text, neat chunks, and complete metadata while still missing the most important value on the page: the number inside a chart.
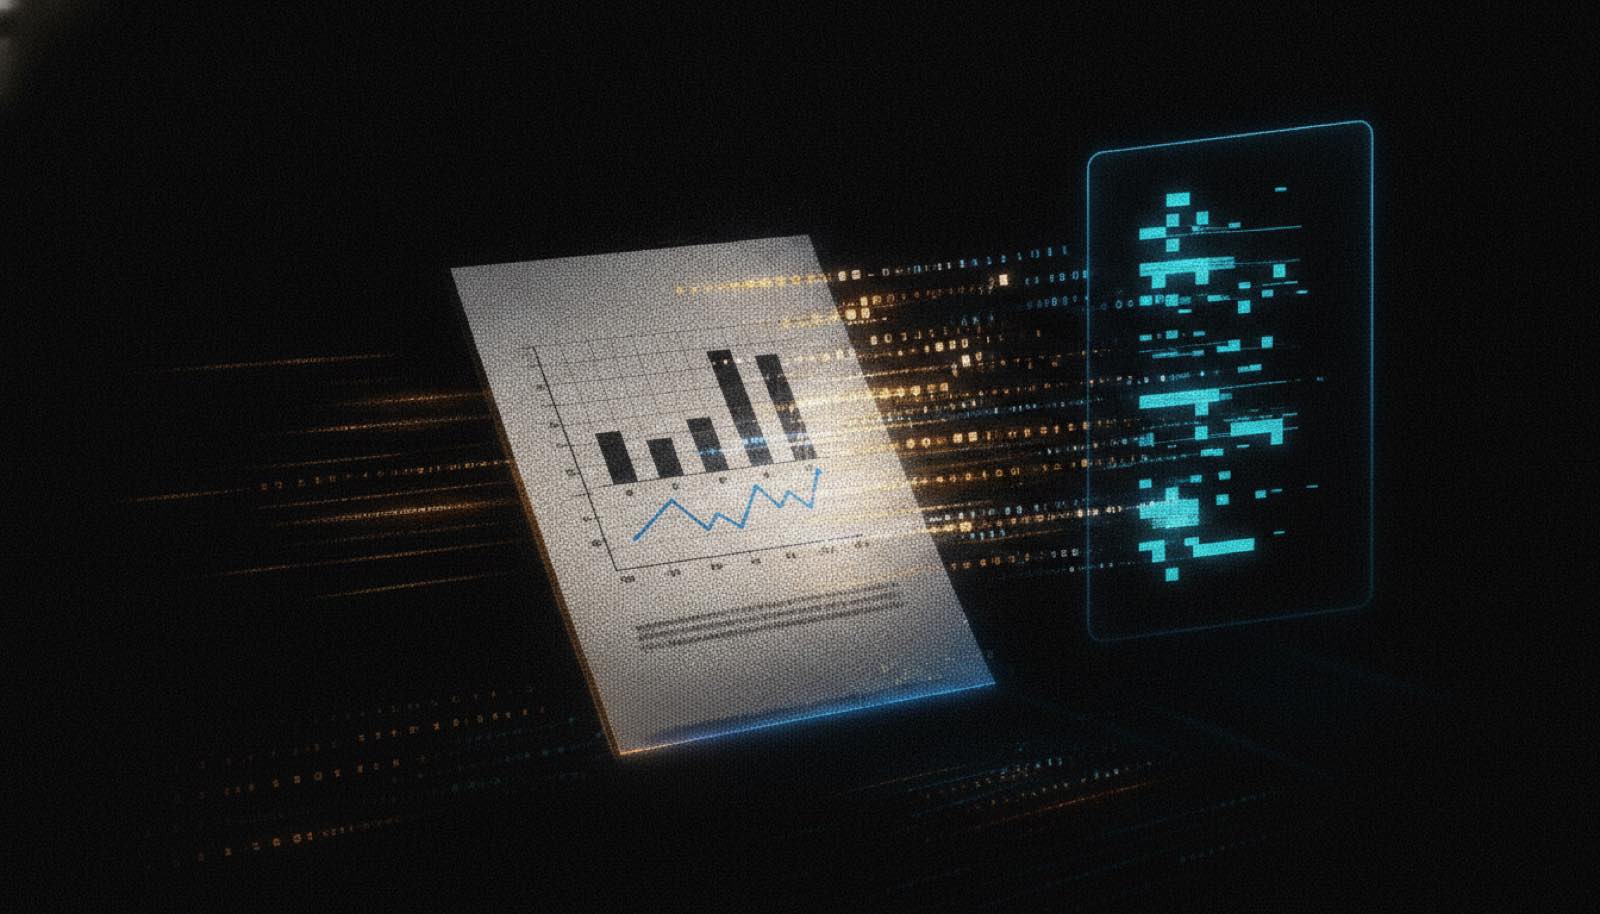
That is where document extraction pipelines quietly fail. A chart is more than an image in the middle of a report. It may contain the revenue trend, clinical threshold, model benchmark, or risk score the downstream system needs. If the parser detects the figure but does not recover the data inside it, every RAG query, agent workflow, or compliance check built on that output inherits the gap.
This post explains why chart extraction fails, what real figure extraction has to recover, and how a vision-model pipeline can return chart data as structured, cited output.
TL;DR
- Most document parsers detect charts but do not extract the values inside them.
- Chart extraction means recovering axis labels, tick values, legends, series names, and data points as structured output.
- Different chart types need different decoding logic: bar charts use height, pie charts use arc angles, heatmaps use color scales, and dual-axis charts use multiple coordinate systems.
- A reliable pipeline detects the figure, classifies the chart type, decodes the visual encoding, and links every value back to its source region.
- Unsiloed AI returns extracted figure output with confidence scores and bounding-box citations, so high-confidence results can pass through automatically and borderline results can be routed for review.
Why Charts Are a Data Trap in Documents
Charts, plots, and figures often carry the densest information in a document. A quarterly revenue chart, a trial outcome plot, or a model benchmark figure can contain the answer a downstream system is supposed to retrieve.
Most document parsers are still built around text. They read embedded PDF text, OCR scanned words, detect tables, and return layout regions. A chart breaks that model because its data lives in visual relationships: bar height, line position, axis scale, legend color, point radius, and spatial grouping. NVIDIA's overview of PDF data extraction for information retrieval explains why closing this gap takes page-element detection and specialized extraction models.
The failure is hard to spot. A parser may return a bounding box labeled figure, or include a screenshot-like image reference, and the output looks complete. But the values inside the chart are missing, so a question like "Which product line drove Q3 growth?" returns nothing if the answer only appeared in a stacked bar chart.
What Chart Extraction Actually Means
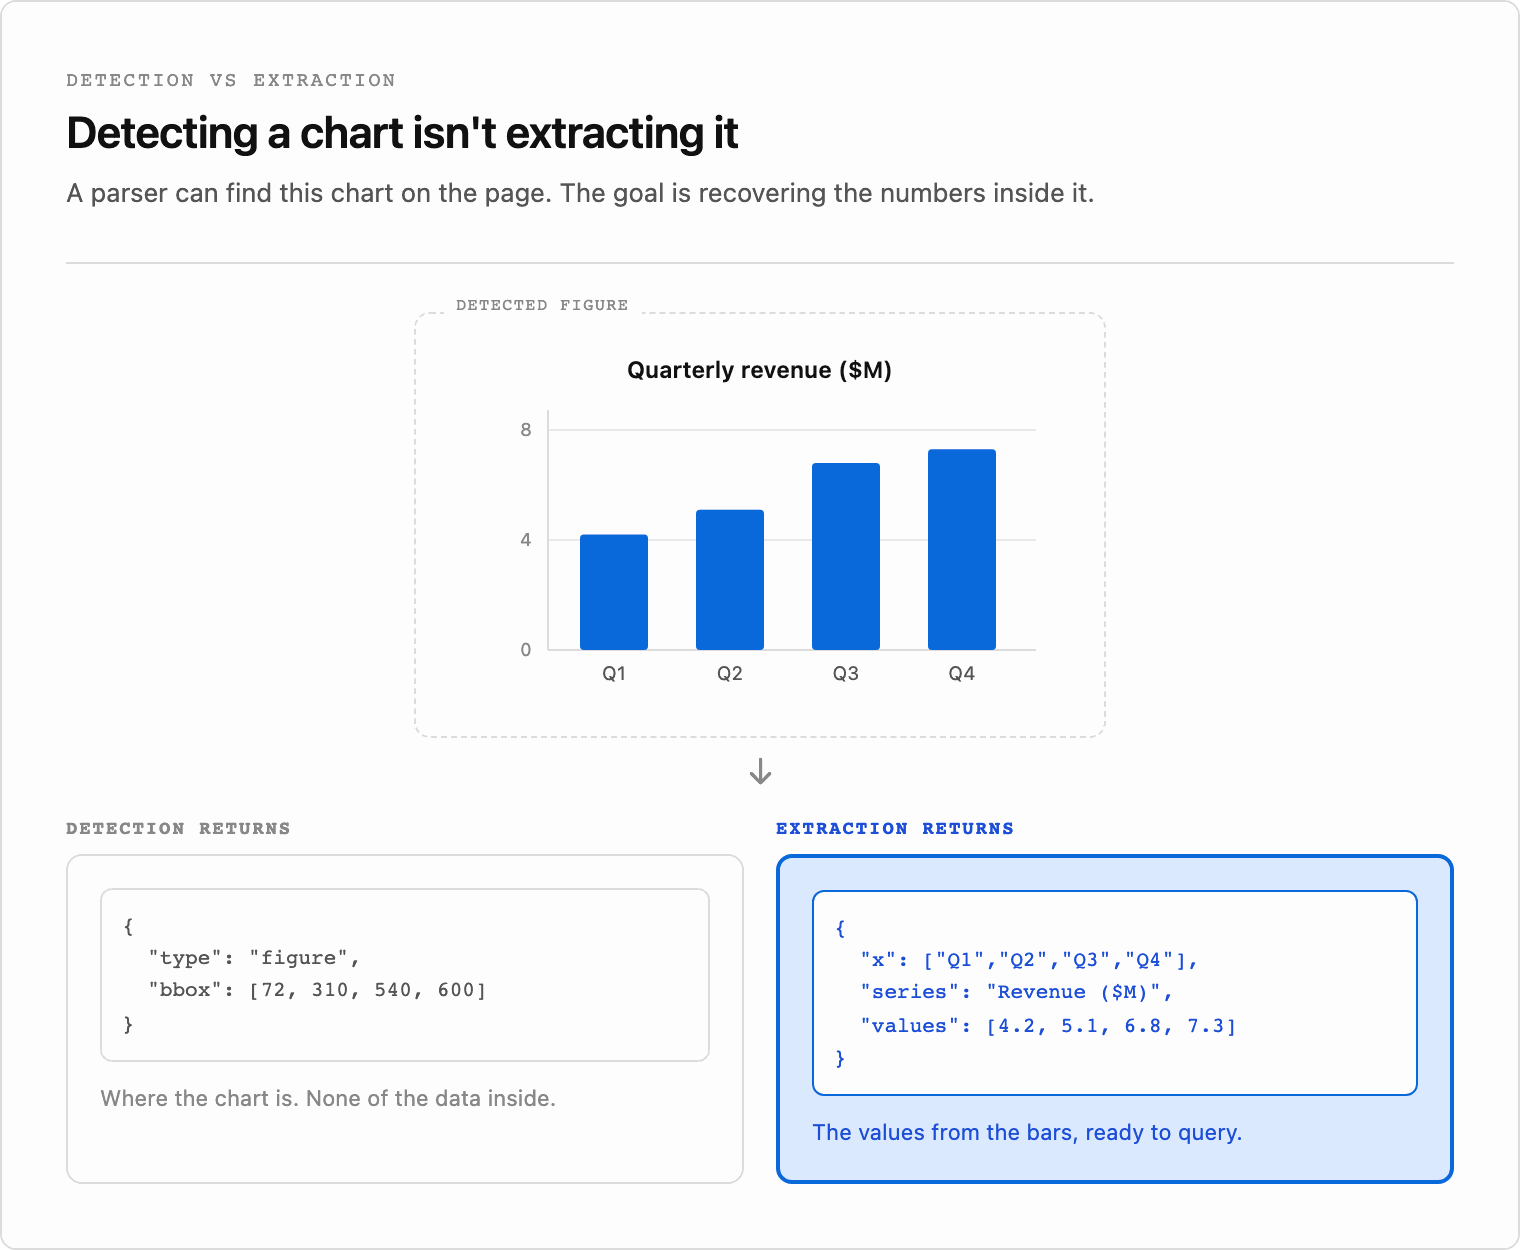
Chart extraction means reconstructing the data encoded inside a visual. A useful extraction returns axis titles, tick labels, legend entries, series names, units, and data-point values. Researchers often call this "chart-to-table" or "derendering" because the goal is to recover the table that produced the chart. Google Research's work on foundation models for chart reasoning shows how image-to-text models can learn to generate a table-like representation of chart data from an image.
Figure detection is not the same thing. Detection tells you where a chart sits on the page. Extraction tells you what the chart says. For pipelines that need numbers, captions, labels, and traceable evidence, a bounding box alone is not enough.
Why Different Chart Types Need Different Decoders
Each chart type encodes data differently, so a generic image-to-text pass is not enough.
| Chart Type | How Data Is Encoded | Why Standard Parsers Fail |
| Bar and column charts | Value mapped to bar height in a raster image | The parser sees the bars as shapes, not values |
| Line charts | Points connected across x/y axes | Tick spacing, units, and point-to-axis mapping are not recovered |
| Pie and donut charts | Values encoded as arc angles | Legend text may be read, but slice values are not tied to geometry |
| Scatter and bubble charts | Two or three encoded dimensions per point | Points need coordinate mapping against axis ranges |
| Heatmaps and matrix charts | Magnitude encoded as color | The color scale has to be calibrated before values can be recovered |
| Combined and dual-axis charts | Multiple series across two coordinate systems | A single-coordinate extraction model mixes or drops series |
This is why chart extraction has to classify the figure before decoding it. A bar chart, heatmap, and dual-axis chart may all sit inside a figure bounding box, but they need different logic to recover their values.
How a Chart Extraction Pipeline Works
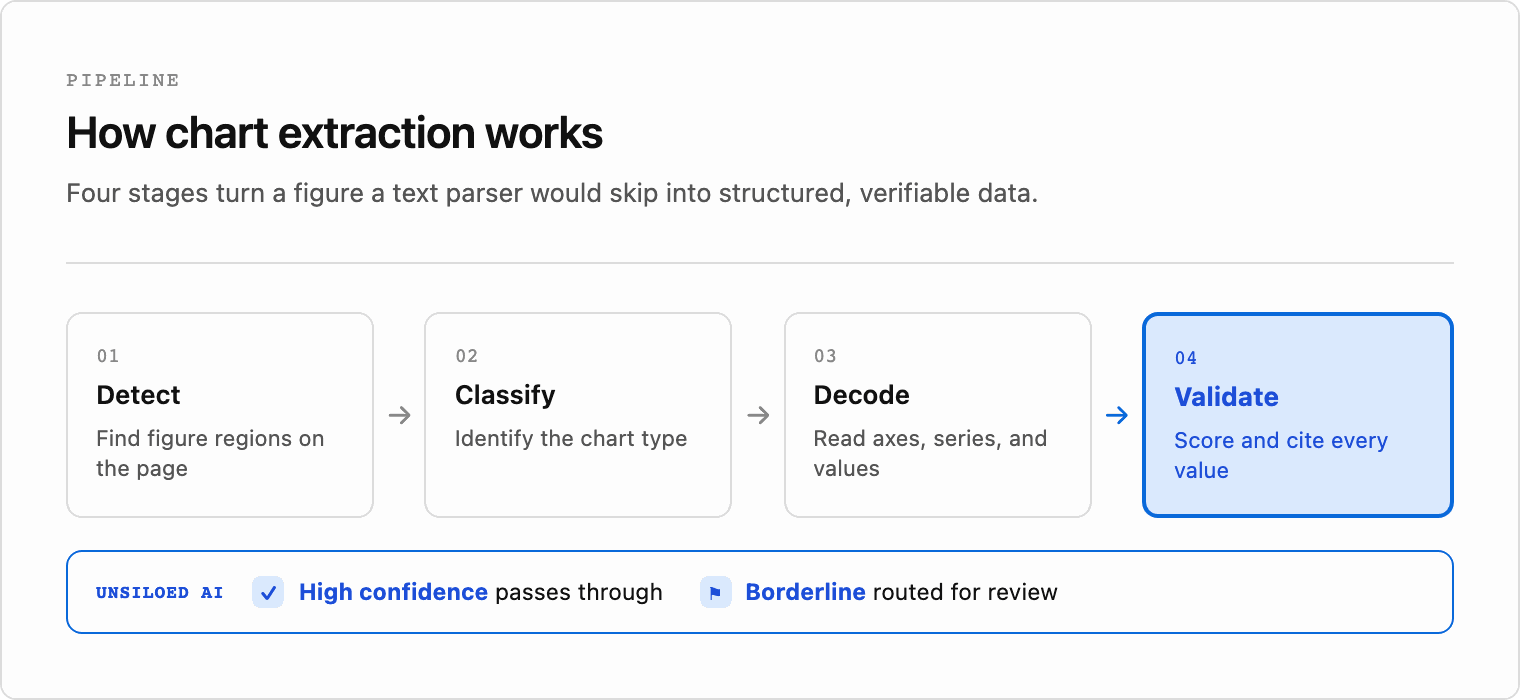
A production chart extraction pipeline usually runs in four stages:
- Detect: A vision model scans each page and marks figure regions with bounding boxes.
- Classify: The system identifies the figure type, such as bar, line, scatter, pie, stacked, or dual-axis.
- Decode: A chart-specific model reads axis scales, tick labels, legends, series, and visual marks, then rebuilds the values as structured data.
- Validate: Extracted figure output comes back with confidence scores and bounding-box citations, so the pipeline can tell which results to trust and which to route for review.
Classification is where text-first parsers usually stop. They can detect that a visual region exists, but they do not know whether the region contains a chart, diagram, scanned table, or decorative image. Without that distinction, the parser either skips the region or returns pixels that still need manual interpretation.
Decoding is the harder part. A pipeline has to handle logarithmic axes, irregular ticks, overlapping series, rotated labels, legends outside the plot area, and low-resolution scans. Layout-aware OCR helps recover nearby text, but chart values still require visual inference.
Validating Chart Data With Confidence Scores
Chart extraction quality changes with chart complexity. Clean bar charts with visible labels parse more reliably. Dense line charts, overlapping series, small tick labels, handwritten annotations, and low-resolution scans produce more uncertainty.
That uncertainty has to be visible in the output. Unsiloed returns confidence scores and bounding-box citations with extracted figure output. The confidence score tells the pipeline how much to trust the extraction. The citation tells a reviewer exactly where to verify it.
That makes automated routing practical. A common routing policy is to pass high-confidence values straight through, flag borderline values for review, and retry, escalate, or exclude low-confidence and partial extractions before they pollute a database, RAG index, or agent workflow.
Localizing Figures and Linking Captions
Reliable figure extraction depends on two related tasks: localization and association. Localization finds the figure boundary. Association links the figure to its caption, title, surrounding paragraph, or nearby table.
Template-based extractors struggle here because they expect figures to appear at fixed coordinates. That works until a report template changes, a caption wraps onto another line, or a figure moves across pages. Caption association also breaks when the caption is a separate text block instead of part of the image.
A vision-first parser uses the full page to detect figure boundaries, then uses spatial reasoning to connect the figure to nearby caption text and section context. That context matters for retrieval. A chart value is much more useful when it is attached to "Figure 3: Q3 revenue by product line" than when it appears as an isolated number.
Chart Extraction at Scale
At scale, chart extraction becomes a pipeline design problem. The model has to extract values, preserve provenance, and expose enough metadata for review and retrieval.
Common failure points include:
- Cross-page context: Figures that span pages or reference a legend elsewhere break parsers that process each page independently, the same issue behind why multi-page tables break extraction pipelines.
- Coordinate systems: Bounding boxes in PDF point space need to map onto rasterized image coordinates. If the API does not return the coordinate system and page dimensions, verification becomes harder.
- Confidence distribution: A parser that performs well on clean charts may degrade on scans, compressed images, and unusual aspect ratios. Per-figure confidence scores let teams route weaker extractions to review.
- Storage format: Structured JSON with axis labels, series names, units, and data-point arrays indexes cleanly for retrieval. Flat text summaries do not preserve enough structure for reliable downstream use.
- Provenance: Linking every extracted value to a page and bounding box keeps audit trails intact when a number is disputed, and supports a stronger chunking strategy for RAG systems.
How Unsiloed AI Handles Chart and Figure Extraction
Most document data extraction software either skips figures or returns an image reference with no structured data attached. Unsiloed AI runs vision-model inference on detected figure regions and returns structured values instead of a raw visual placeholder.
For bar charts and line plots, that means axis labels, series names, units, and data-point values. For annotated figures, it means caption text, callout labels, and the spatial relationships between annotations and the regions they mark. These are the figure-level signals that multimodal data extraction tools need before they can support reliable AI agents or document workflows.
Extracted figure output includes confidence scores and bounding-box citations back to source regions, so downstream systems can verify what was extracted and where it came from.
When Chart Extraction Matters
Chart extraction matters whenever a document pipeline has to answer questions from visual evidence, beyond body text alone.
Use a chart-aware parser when your documents include:
- Financial reports with revenue, forecast, or variance charts
- Scientific papers with plots, benchmarks, or experimental results
- Medical and clinical documents with threshold charts or outcome figures
- Legal, insurance, or compliance documents with timelines, risk matrices, or annotated diagrams
- Product, operations, or manufacturing reports with trend charts and dashboards
If those figures are skipped, the pipeline does not merely lose nice-to-have context. It loses source data.
Final Thoughts on Building a Reliable Chart Extraction Pipeline
Skipped charts are systematic data loss. They are hard to spot because the parser may still return a clean-looking document structure, but the values that mattered never enter the pipeline.
A reliable chart extraction workflow detects figures, classifies chart types, decodes visual encodings, returns structured data, and ties extracted output to confidence scores and source regions. To see how Unsiloed handles chart extraction in production document workflows, book a demo.
FAQ
What's the difference between figure detection and chart extraction?
Figure detection locates where a chart or figure sits on a page and returns its bounding-box coordinates. Chart extraction goes further by recovering the encoded data inside that figure, including axis labels, tick values, legends, series names, and plotted quantities.
Can OCR extract data from charts in a PDF?
OCR can read text labels in and around a chart, but it cannot recover the chart values by itself. Chart values are encoded visually through geometry, color, position, and scale. A vision pipeline has to detect the figure, classify the chart type, and decode the visual encoding into structured data.
What should a chart extraction API return?
A useful chart extraction API should return structured data, not a bare image crop. Look for axis labels, units, tick values, legend entries, series names, data-point values, confidence scores, and source citations such as page numbers and bounding boxes.
How do I validate extracted chart data at scale?
Route extractions by confidence score. High-confidence values can pass through automatically, while borderline values should be flagged for review. Bounding-box citations make review faster because each value points back to the exact source region in the document.
How does Unsiloed AI handle chart and figure extraction?
Unsiloed AI runs vision-model inference on detected figure regions, returning structured values for charts and spatial context for annotated figures. Extracted figure output includes confidence scores and bounding-box citations, so downstream systems can verify the result before using it in search, analytics, or automation.