> ## Documentation Index
> Fetch the complete documentation index at: https://docs.unsiloed.ai/docs/llms.txt
> Use this file to discover all available pages before exploring further.
# Extract Chart Data with a Custom Function in Google Sheets
> Create an UNSILOED_CHART custom function that turns a chart image into clean, numeric rows and columns in Google Sheets.
Charts often contain values that aren't available as selectable text. A Google
Sheets custom function can send a chart image to Unsiloed and return its
categories and series as editable cells.
In this guide, we'll create `UNSILOED_CHART`. The function downloads a chart
image, asks Unsiloed for a chart-ready Markdown table, and converts the table to
numeric spreadsheet values. The finished formula looks like this:
```excel theme={null}
=UNSILOED_CHART(A2, B2)
```
The function accepts an image URL in `A2`. The value in `B2` triggers another
status check when parsing takes longer than one formula execution. An optional
third argument returns a numeric x-axis for scatter charts. In the example
below, Unsiloed extracts 20 quarters from a dual-axis chart, including revenue
in millions of pounds and margin as a percentage. We then rebuild it as an
editable combination chart.
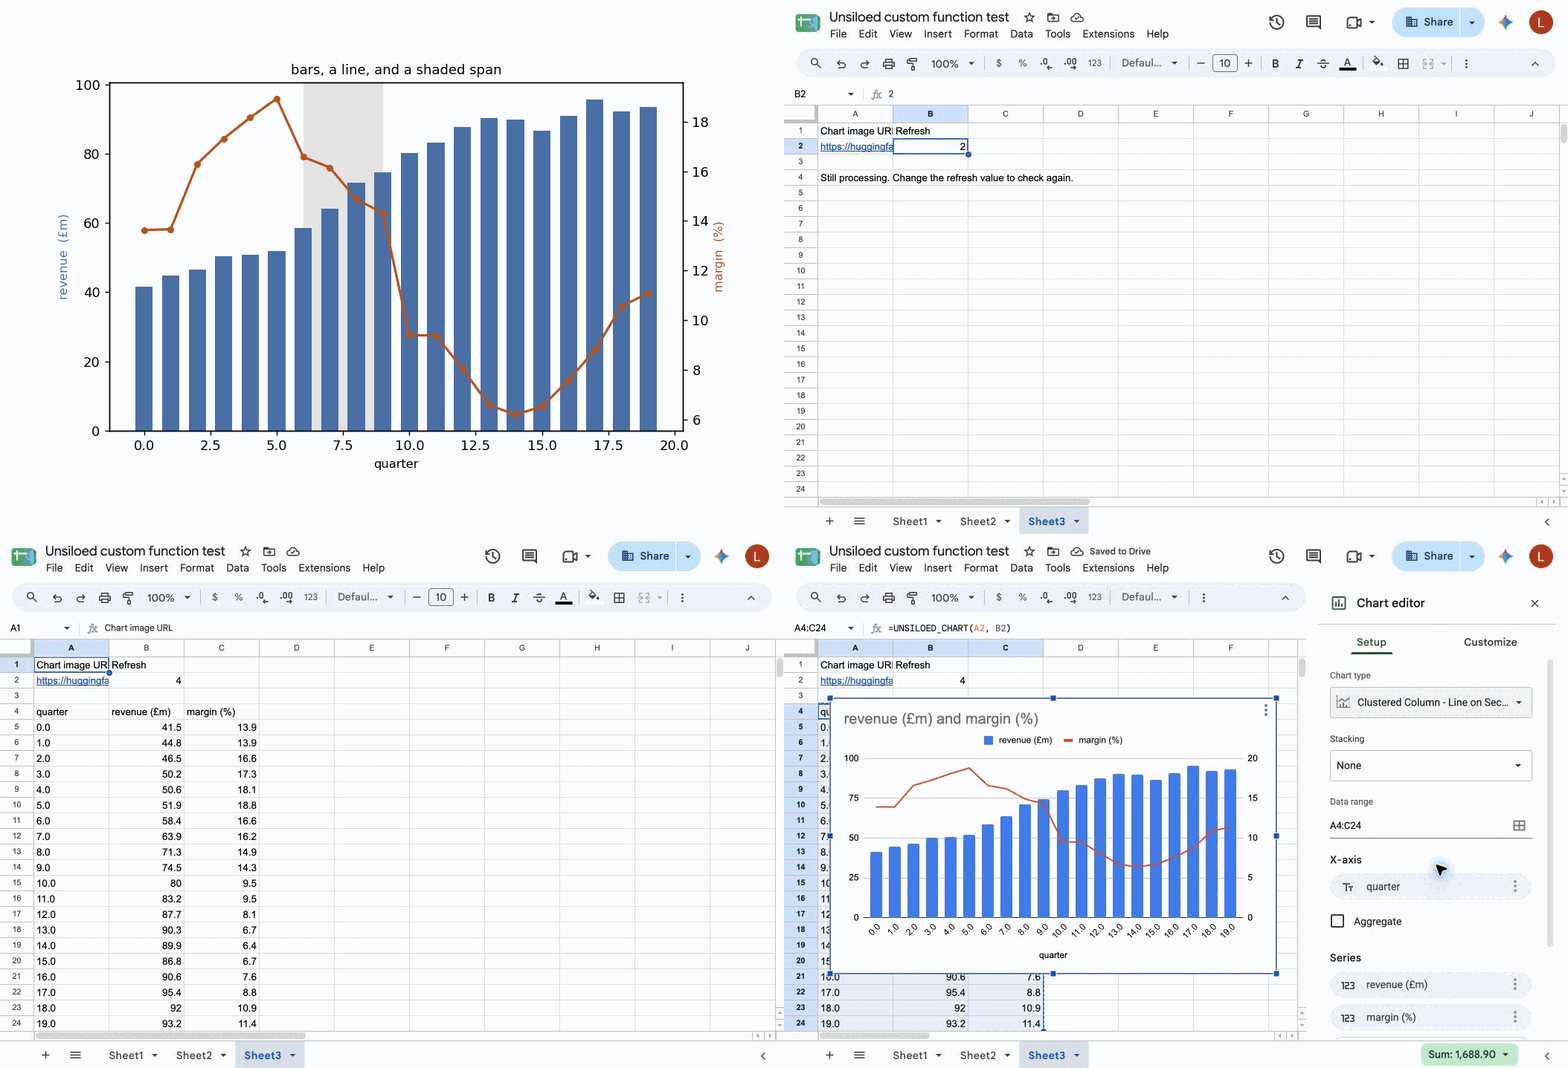 Custom functions can return values but can't insert or modify a Google Sheets
chart. After the data spills into the sheet, we'll use **Insert → Chart** to
create an editable chart from it.
## What We'll Build
The custom function performs five operations:
1. It downloads a public chart image and uploads the bytes to `/parse`.
2. It asks the page analyzer to end its response with one Markdown data table.
3. It stores the returned job ID so later calculations can reuse it.
4. It checks the job once during each calculation.
5. It converts the table into validated, chart-ready rows and numeric series.
Google stops a custom function after 30 seconds, and Apps Script can't interrupt
an outstanding URL fetch. If the job is still running, the formula returns a
status message. Change the refresh value later to check the saved job again. For
slower or business-critical workflows, use the menu-driven cookbook instead.
Paste this into `Code.gs`, replacing its contents. The script reads the API key
from the script property configured in [Step 3](#step-3-store-your-api-key).
```javascript Code.gs theme={null}
const UNSILOED_BASE_URL = "https://prod.visionapi.unsiloed.ai";
const UNSILOED_JOB_MAX_AGE_MS = 24 * 60 * 60 * 1000;
const UNSILOED_MAX_CACHED_JOBS = 50;
const UNSILOED_JOB_VERSION = "chart-v6";
const UNSILOED_JOB_PREFIX = "UNSILOED_JOB_";
const UNSILOED_CHART_PROMPT = [
"Extract every visible chart data point.",
"Preserve category labels, series names, and units exactly.",
"End with exactly one Markdown table.",
"Put category or x-axis values in the first column",
"and numeric series encoded by chart marks in the remaining columns.",
"Do not add columns that only repeat plotted values as text, rankings, annotations,",
"or derived comparisons.",
"Every data row must contain the plotted value when it is visible.",
"Include visible units in series headers.",
"Keep values on multiple axes in their original units.",
"For visible error bars, add numeric x error and y error columns.",
"Use an empty cell only for a genuinely missing value.",
"Use a period as the decimal separator.",
"Do not put units or grouping separators in numeric cells."
].join(" ");
/**
* Extracts chart data from a public image URL.
*
* @param {string} imageUrl A public PNG, JPEG, or TIFF URL.
* @param {*} refresh Change this value to check an unfinished job again.
* @param {boolean} numericX Use TRUE to return a numeric first column.
* @return {Array>} Chart-ready data.
* @customfunction
*/
function UNSILOED_CHART(imageUrl, refresh, numericX) {
void refresh;
if (Array.isArray(imageUrl)) imageUrl = imageUrl[0][0];
imageUrl = String(imageUrl || "").trim();
if (!/^https?:\/\//i.test(imageUrl)) {
throw new Error("Pass a public HTTP image URL.");
}
const apiKey = unsiloedApiKey();
const jobId = getOrCreateChartJob(imageUrl, apiKey);
let job;
try {
job = unsiloedRequest(
"/parse/" + encodeURIComponent(jobId),
apiKey
);
} catch (error) {
if (error.httpStatus === 404) {
const cleared = clearCachedChartJob(imageUrl, apiKey, jobId);
const action = cleared
? "The saved job was cleared. Change the refresh value to submit it again."
: "Change the refresh value to try again.";
throw new Error("The saved parse job no longer exists. " + action);
}
throw error;
}
if (job.status === "Succeeded") {
return firstChartRows(job, numericX === true);
}
if (job.status === "Failed" || job.status === "Cancelled") {
const cleared = clearCachedChartJob(imageUrl, apiKey, jobId);
const action = cleared
? "The saved job was cleared. Change the refresh value to submit it again."
: "Change the refresh value to try again.";
throw new Error(
(job.message || "Parsing " + job.status.toLowerCase() + ".") + " " + action
);
}
return [["Still processing. Change the refresh value to check again."]];
}
function unsiloedApiKey() {
const apiKey = PropertiesService.getScriptProperties()
.getProperty("UNSILOED_API_KEY");
if (!apiKey) throw new Error("Add UNSILOED_API_KEY to the script properties.");
return apiKey;
}
function getOrCreateChartJob(imageUrl, apiKey) {
const properties = PropertiesService.getScriptProperties();
const propertyName = jobPropertyName(imageUrl, apiKey);
const cached = readCachedChartJob(properties, propertyName);
if (cached) return cached.jobId;
const lock = LockService.getScriptLock();
if (!lock.tryLock(5000)) throw new Error("Try the formula again.");
try {
const checkedAgain = readCachedChartJob(properties, propertyName);
if (checkedAgain) return checkedAgain.jobId;
pruneChartJobs(properties);
const image = fetchChartImage(imageUrl);
const started = unsiloedRequest("/parse", apiKey, {
method: "post",
payload: chartParsePayload(image)
});
if (typeof started.job_id !== "string" || !started.job_id) {
throw new Error("Unsiloed returned no job ID.");
}
properties.setProperty(propertyName, JSON.stringify({
jobId: started.job_id,
createdAt: Date.now()
}));
return started.job_id;
} finally {
lock.releaseLock();
}
}
function readCachedChartJob(properties, propertyName) {
const saved = properties.getProperty(propertyName);
if (!saved) return null;
try {
const state = JSON.parse(saved);
const age = Date.now() - state.createdAt;
if (
typeof state.jobId === "string" &&
state.jobId &&
Number.isFinite(state.createdAt) &&
age >= 0 &&
age < UNSILOED_JOB_MAX_AGE_MS
) {
return state;
}
} catch (error) {
// Invalid entries are removed during the next locked cleanup.
}
return null;
}
function clearCachedChartJob(imageUrl, apiKey, jobId) {
const properties = PropertiesService.getScriptProperties();
const propertyName = jobPropertyName(imageUrl, apiKey);
const lock = LockService.getScriptLock();
if (!lock.tryLock(5000)) return false;
try {
const saved = properties.getProperty(propertyName);
if (!saved) return true;
try {
const state = JSON.parse(saved);
if (state.jobId !== jobId) return false;
} catch (error) {
// The matching property is unusable and can be removed.
}
properties.deleteProperty(propertyName);
return true;
} finally {
lock.releaseLock();
}
}
function pruneChartJobs(properties) {
const all = properties.getProperties();
const now = Date.now();
const valid = [];
Object.keys(all).forEach(key => {
if (key.indexOf(UNSILOED_JOB_PREFIX) !== 0) return;
try {
const state = JSON.parse(all[key]);
const age = now - state.createdAt;
if (
typeof state.jobId === "string" &&
state.jobId &&
Number.isFinite(state.createdAt) &&
age >= 0 &&
age < UNSILOED_JOB_MAX_AGE_MS
) {
valid.push({ key: key, createdAt: state.createdAt });
}
} catch (error) {
// Invalid entries are excluded from the retained set.
}
});
valid.sort((a, b) => b.createdAt - a.createdAt);
const retained = new Set(
valid.slice(0, Math.max(UNSILOED_MAX_CACHED_JOBS - 1, 0))
.map(entry => entry.key)
);
Object.keys(all).forEach(key => {
if (
key.indexOf(UNSILOED_JOB_PREFIX) === 0 &&
!retained.has(key)
) {
properties.deleteProperty(key);
}
});
}
function chartParsePayload(image) {
const segmentAnalysis = {
Page: {
markdown: "VLM",
model_id: "nova",
vlm: UNSILOED_CHART_PROMPT
}
};
const outputFields = {
html: false,
markdown: true,
ocr: false,
image: false,
content: false,
bbox: false,
confidence: false,
embed: false,
chart_data: false
};
return {
file: image,
use_high_resolution: "true",
layout_analysis: "page_by_page",
segment_analysis: JSON.stringify(segmentAnalysis),
response_profile: "custom",
output_fields: JSON.stringify(outputFields)
};
}
function fetchChartImage(imageUrl) {
const response = UrlFetchApp.fetch(imageUrl, {
followRedirects: true,
muteHttpExceptions: true
});
const status = response.getResponseCode();
if (status < 200 || status >= 300) {
throw new Error("The image URL returned HTTP " + status + ".");
}
const image = response.getBlob();
if (!/^image\//i.test(image.getContentType())) {
throw new Error("The URL did not return an image.");
}
const path = imageUrl.split(/[?#]/)[0];
const fileName = path.substring(path.lastIndexOf("/") + 1) || "chart.png";
return image.setName(fileName);
}
function jobPropertyName(imageUrl, apiKey) {
const digest = Utilities.computeDigest(
Utilities.DigestAlgorithm.SHA_256,
UNSILOED_JOB_VERSION + "\n" + imageUrl + "\n" + apiKey,
Utilities.Charset.UTF_8
);
const hex = digest.map(byte =>
(byte + 256).toString(16).slice(-2)
).join("");
return UNSILOED_JOB_PREFIX + hex;
}
function unsiloedRequest(path, apiKey, options) {
const requestOptions = options || {};
const response = UrlFetchApp.fetch(UNSILOED_BASE_URL + path, {
muteHttpExceptions: true,
...requestOptions,
headers: {
...(requestOptions.headers || {}),
"api-key": apiKey
}
});
const text = response.getContentText();
const status = response.getResponseCode();
if (status >= 200 && status < 300) return JSON.parse(text);
let message = text;
try {
const body = JSON.parse(text);
message = body.error?.message || body.message || body.detail || text;
} catch (error) {
// Keep the plain-text response.
}
const requestError = new Error(
message || "Unsiloed returned HTTP " + status + "."
);
requestError.httpStatus = status;
throw requestError;
}
function firstChartRows(job, numericX) {
const tables = (job.chunks || [])
.flatMap(chunk => chunk.segments || [])
.flatMap(segment => markdownTables(segment.markdown || ""));
const candidates = [];
let conversionError = null;
tables.forEach(rows => {
if (rows.length < 2 || rows[0].length < 2) return;
try {
const converted = rows.map((row, rowIndex) => row.map(
(cell, columnIndex) =>
rowIndex === 0 || (columnIndex === 0 && !numericX)
? cell
: chartValue(cell)
));
if (numericX) {
converted.slice(1).forEach((row, rowIndex) => {
if (typeof row[0] !== "number") {
throw new Error(
'X-axis value in row ' + (rowIndex + 2) +
' is not numeric: "' + row[0] + '".'
);
}
});
}
candidates.push(chartReadyRows(converted));
} catch (error) {
conversionError = error;
}
});
if (candidates.length > 1) {
throw new Error("Unsiloed returned more than one chart-ready table.");
}
if (candidates.length === 1) return candidates[0];
if (conversionError) throw conversionError;
throw new Error("Unsiloed did not return a chart data table.");
}
function markdownTables(markdown) {
const lines = markdown.split(/\r?\n/);
const tables = [];
for (let index = 0; index < lines.length - 1; index += 1) {
const header = splitMarkdownRow(lines[index]);
const separator = splitMarkdownRow(lines[index + 1]);
if (
header.length < 2 ||
separator.length !== header.length ||
!separator.every(cell => /^:?-+:?$/.test(cell))
) {
continue;
}
const width = header.length;
const rows = [header];
index += 2;
while (index < lines.length && isMarkdownRow(lines[index])) {
const row = splitMarkdownRow(lines[index]);
if (row.length > width) {
throw new Error("A Markdown data row has more cells than its header.");
}
rows.push(row.concat(Array(width - row.length).fill("")));
index += 1;
}
if (rows.length > 1) tables.push(rows);
index -= 1;
}
return tables;
}
function isMarkdownRow(line) {
return splitMarkdownRow(line).length > 1;
}
function splitMarkdownRow(line) {
let body = String(line || "").trim();
if (body.charAt(0) === "|") body = body.slice(1);
if (endsWithUnescapedPipe(body)) body = body.slice(0, -1);
const cells = [];
let cell = "";
for (let index = 0; index < body.length; index += 1) {
const character = body.charAt(index);
const next = body.charAt(index + 1);
if (character === "\\" && next && isMarkdownEscapable(next)) {
cell += next;
index += 1;
} else if (character === "|") {
cells.push(cleanMarkdownCell(cell));
cell = "";
} else {
cell += character;
}
}
cells.push(cleanMarkdownCell(cell));
return cells;
}
function endsWithUnescapedPipe(text) {
if (text.charAt(text.length - 1) !== "|") return false;
let backslashes = 0;
for (
let index = text.length - 2;
index >= 0 && text.charAt(index) === "\\";
index -= 1
) {
backslashes += 1;
}
return backslashes % 2 === 0;
}
function isMarkdownEscapable(character) {
const code = character.charCodeAt(0);
return (
(code >= 33 && code <= 47) ||
(code >= 58 && code <= 64) ||
(code >= 91 && code <= 96) ||
(code >= 123 && code <= 126)
);
}
function cleanMarkdownCell(cell) {
return cell.trim()
.replace(/^\*\*(.*)\*\*$/, "$1")
.replace(/`([^`]*)`/g, "$1");
}
function chartReadyRows(rows) {
const columns = [0];
for (let column = 1; column < rows[0].length; column += 1) {
const values = rows.slice(1).map(row => row[column]);
const populated = values.filter(value => value !== "");
const numeric = populated.filter(value => typeof value === "number");
if (populated.length === 0) {
throw new Error(
'Column "' + (rows[0][column] || column + 1) + '" has no values.'
);
}
if (numeric.length !== populated.length) {
const invalid = populated.find(value => typeof value !== "number");
throw new Error(
'Column "' + (rows[0][column] || column + 1) +
'" contains a nonnumeric value: "' + invalid + '".'
);
}
columns.push(column);
}
if (columns.length === 1) {
throw new Error("Unsiloed returned no numeric chart series.");
}
return rows.map(row => columns.map(column => row[column]));
}
function chartValue(cell) {
const value = cell.trim();
if (!value) return "";
const normalized = value.replace(/\u2212/g, "-");
const looksNumeric = /^[+-]?(?:\d[\d.,]*|\.\d+)(?:e[+-]?\d+)?$/i
.test(normalized);
if (looksNumeric && normalized.indexOf(",") !== -1) {
throw new Error('Numeric cell "' + value + '" contains a comma.');
}
if (!/^[+-]?(?:\d+\.?\d*|\.\d+)(?:e[+-]?\d+)?$/i.test(normalized)) {
return value;
}
const number = Number(normalized);
if (!Number.isFinite(number)) {
throw new Error('Numeric cell "' + value + '" is outside the supported range.');
}
if (Number.isInteger(number) && !Number.isSafeInteger(number)) {
throw new Error('Integer cell "' + value + '" cannot be represented exactly.');
}
return number;
}
```
## Requirements for the Custom Function
Before you start, gather:
* A Google account and a spreadsheet you can edit
* An Unsiloed API key from the [Unsiloed dashboard](https://app.unsiloed.ai)
* A public PNG, JPEG, or TIFF URL that returns the image bytes
A private Google Drive sharing link doesn't work because the custom function
can't use an interactive download page. Use a direct public URL or a presigned
cloud-storage URL.
This guide uses the synthetic D11 dual-axis chart from the Unsiloed
[ChartParse-Bench dataset](https://huggingface.co/datasets/Unsiloed/chart-parse-bench),
published under CC BY 4.0. The dataset accompanies the [chart-parsing benchmark
article](https://www.unsiloed.ai/blog/unsiloed-achieves-sota-chart-parsing):
```text theme={null}
https://huggingface.co/datasets/Unsiloed/chart-parse-bench/resolve/ba7316eb4c398963163b8f2d21d97142db1d8ce6/images/D11.png
```
## Step 1: Open the Apps Script Editor
The custom function lives in the Apps Script project attached to the
spreadsheet.
In Google Sheets, choose **Extensions → Apps Script**.
Custom functions can return values but can't insert or modify a Google Sheets
chart. After the data spills into the sheet, we'll use **Insert → Chart** to
create an editable chart from it.
## What We'll Build
The custom function performs five operations:
1. It downloads a public chart image and uploads the bytes to `/parse`.
2. It asks the page analyzer to end its response with one Markdown data table.
3. It stores the returned job ID so later calculations can reuse it.
4. It checks the job once during each calculation.
5. It converts the table into validated, chart-ready rows and numeric series.
Google stops a custom function after 30 seconds, and Apps Script can't interrupt
an outstanding URL fetch. If the job is still running, the formula returns a
status message. Change the refresh value later to check the saved job again. For
slower or business-critical workflows, use the menu-driven cookbook instead.
Paste this into `Code.gs`, replacing its contents. The script reads the API key
from the script property configured in [Step 3](#step-3-store-your-api-key).
```javascript Code.gs theme={null}
const UNSILOED_BASE_URL = "https://prod.visionapi.unsiloed.ai";
const UNSILOED_JOB_MAX_AGE_MS = 24 * 60 * 60 * 1000;
const UNSILOED_MAX_CACHED_JOBS = 50;
const UNSILOED_JOB_VERSION = "chart-v6";
const UNSILOED_JOB_PREFIX = "UNSILOED_JOB_";
const UNSILOED_CHART_PROMPT = [
"Extract every visible chart data point.",
"Preserve category labels, series names, and units exactly.",
"End with exactly one Markdown table.",
"Put category or x-axis values in the first column",
"and numeric series encoded by chart marks in the remaining columns.",
"Do not add columns that only repeat plotted values as text, rankings, annotations,",
"or derived comparisons.",
"Every data row must contain the plotted value when it is visible.",
"Include visible units in series headers.",
"Keep values on multiple axes in their original units.",
"For visible error bars, add numeric x error and y error columns.",
"Use an empty cell only for a genuinely missing value.",
"Use a period as the decimal separator.",
"Do not put units or grouping separators in numeric cells."
].join(" ");
/**
* Extracts chart data from a public image URL.
*
* @param {string} imageUrl A public PNG, JPEG, or TIFF URL.
* @param {*} refresh Change this value to check an unfinished job again.
* @param {boolean} numericX Use TRUE to return a numeric first column.
* @return {Array>} Chart-ready data.
* @customfunction
*/
function UNSILOED_CHART(imageUrl, refresh, numericX) {
void refresh;
if (Array.isArray(imageUrl)) imageUrl = imageUrl[0][0];
imageUrl = String(imageUrl || "").trim();
if (!/^https?:\/\//i.test(imageUrl)) {
throw new Error("Pass a public HTTP image URL.");
}
const apiKey = unsiloedApiKey();
const jobId = getOrCreateChartJob(imageUrl, apiKey);
let job;
try {
job = unsiloedRequest(
"/parse/" + encodeURIComponent(jobId),
apiKey
);
} catch (error) {
if (error.httpStatus === 404) {
const cleared = clearCachedChartJob(imageUrl, apiKey, jobId);
const action = cleared
? "The saved job was cleared. Change the refresh value to submit it again."
: "Change the refresh value to try again.";
throw new Error("The saved parse job no longer exists. " + action);
}
throw error;
}
if (job.status === "Succeeded") {
return firstChartRows(job, numericX === true);
}
if (job.status === "Failed" || job.status === "Cancelled") {
const cleared = clearCachedChartJob(imageUrl, apiKey, jobId);
const action = cleared
? "The saved job was cleared. Change the refresh value to submit it again."
: "Change the refresh value to try again.";
throw new Error(
(job.message || "Parsing " + job.status.toLowerCase() + ".") + " " + action
);
}
return [["Still processing. Change the refresh value to check again."]];
}
function unsiloedApiKey() {
const apiKey = PropertiesService.getScriptProperties()
.getProperty("UNSILOED_API_KEY");
if (!apiKey) throw new Error("Add UNSILOED_API_KEY to the script properties.");
return apiKey;
}
function getOrCreateChartJob(imageUrl, apiKey) {
const properties = PropertiesService.getScriptProperties();
const propertyName = jobPropertyName(imageUrl, apiKey);
const cached = readCachedChartJob(properties, propertyName);
if (cached) return cached.jobId;
const lock = LockService.getScriptLock();
if (!lock.tryLock(5000)) throw new Error("Try the formula again.");
try {
const checkedAgain = readCachedChartJob(properties, propertyName);
if (checkedAgain) return checkedAgain.jobId;
pruneChartJobs(properties);
const image = fetchChartImage(imageUrl);
const started = unsiloedRequest("/parse", apiKey, {
method: "post",
payload: chartParsePayload(image)
});
if (typeof started.job_id !== "string" || !started.job_id) {
throw new Error("Unsiloed returned no job ID.");
}
properties.setProperty(propertyName, JSON.stringify({
jobId: started.job_id,
createdAt: Date.now()
}));
return started.job_id;
} finally {
lock.releaseLock();
}
}
function readCachedChartJob(properties, propertyName) {
const saved = properties.getProperty(propertyName);
if (!saved) return null;
try {
const state = JSON.parse(saved);
const age = Date.now() - state.createdAt;
if (
typeof state.jobId === "string" &&
state.jobId &&
Number.isFinite(state.createdAt) &&
age >= 0 &&
age < UNSILOED_JOB_MAX_AGE_MS
) {
return state;
}
} catch (error) {
// Invalid entries are removed during the next locked cleanup.
}
return null;
}
function clearCachedChartJob(imageUrl, apiKey, jobId) {
const properties = PropertiesService.getScriptProperties();
const propertyName = jobPropertyName(imageUrl, apiKey);
const lock = LockService.getScriptLock();
if (!lock.tryLock(5000)) return false;
try {
const saved = properties.getProperty(propertyName);
if (!saved) return true;
try {
const state = JSON.parse(saved);
if (state.jobId !== jobId) return false;
} catch (error) {
// The matching property is unusable and can be removed.
}
properties.deleteProperty(propertyName);
return true;
} finally {
lock.releaseLock();
}
}
function pruneChartJobs(properties) {
const all = properties.getProperties();
const now = Date.now();
const valid = [];
Object.keys(all).forEach(key => {
if (key.indexOf(UNSILOED_JOB_PREFIX) !== 0) return;
try {
const state = JSON.parse(all[key]);
const age = now - state.createdAt;
if (
typeof state.jobId === "string" &&
state.jobId &&
Number.isFinite(state.createdAt) &&
age >= 0 &&
age < UNSILOED_JOB_MAX_AGE_MS
) {
valid.push({ key: key, createdAt: state.createdAt });
}
} catch (error) {
// Invalid entries are excluded from the retained set.
}
});
valid.sort((a, b) => b.createdAt - a.createdAt);
const retained = new Set(
valid.slice(0, Math.max(UNSILOED_MAX_CACHED_JOBS - 1, 0))
.map(entry => entry.key)
);
Object.keys(all).forEach(key => {
if (
key.indexOf(UNSILOED_JOB_PREFIX) === 0 &&
!retained.has(key)
) {
properties.deleteProperty(key);
}
});
}
function chartParsePayload(image) {
const segmentAnalysis = {
Page: {
markdown: "VLM",
model_id: "nova",
vlm: UNSILOED_CHART_PROMPT
}
};
const outputFields = {
html: false,
markdown: true,
ocr: false,
image: false,
content: false,
bbox: false,
confidence: false,
embed: false,
chart_data: false
};
return {
file: image,
use_high_resolution: "true",
layout_analysis: "page_by_page",
segment_analysis: JSON.stringify(segmentAnalysis),
response_profile: "custom",
output_fields: JSON.stringify(outputFields)
};
}
function fetchChartImage(imageUrl) {
const response = UrlFetchApp.fetch(imageUrl, {
followRedirects: true,
muteHttpExceptions: true
});
const status = response.getResponseCode();
if (status < 200 || status >= 300) {
throw new Error("The image URL returned HTTP " + status + ".");
}
const image = response.getBlob();
if (!/^image\//i.test(image.getContentType())) {
throw new Error("The URL did not return an image.");
}
const path = imageUrl.split(/[?#]/)[0];
const fileName = path.substring(path.lastIndexOf("/") + 1) || "chart.png";
return image.setName(fileName);
}
function jobPropertyName(imageUrl, apiKey) {
const digest = Utilities.computeDigest(
Utilities.DigestAlgorithm.SHA_256,
UNSILOED_JOB_VERSION + "\n" + imageUrl + "\n" + apiKey,
Utilities.Charset.UTF_8
);
const hex = digest.map(byte =>
(byte + 256).toString(16).slice(-2)
).join("");
return UNSILOED_JOB_PREFIX + hex;
}
function unsiloedRequest(path, apiKey, options) {
const requestOptions = options || {};
const response = UrlFetchApp.fetch(UNSILOED_BASE_URL + path, {
muteHttpExceptions: true,
...requestOptions,
headers: {
...(requestOptions.headers || {}),
"api-key": apiKey
}
});
const text = response.getContentText();
const status = response.getResponseCode();
if (status >= 200 && status < 300) return JSON.parse(text);
let message = text;
try {
const body = JSON.parse(text);
message = body.error?.message || body.message || body.detail || text;
} catch (error) {
// Keep the plain-text response.
}
const requestError = new Error(
message || "Unsiloed returned HTTP " + status + "."
);
requestError.httpStatus = status;
throw requestError;
}
function firstChartRows(job, numericX) {
const tables = (job.chunks || [])
.flatMap(chunk => chunk.segments || [])
.flatMap(segment => markdownTables(segment.markdown || ""));
const candidates = [];
let conversionError = null;
tables.forEach(rows => {
if (rows.length < 2 || rows[0].length < 2) return;
try {
const converted = rows.map((row, rowIndex) => row.map(
(cell, columnIndex) =>
rowIndex === 0 || (columnIndex === 0 && !numericX)
? cell
: chartValue(cell)
));
if (numericX) {
converted.slice(1).forEach((row, rowIndex) => {
if (typeof row[0] !== "number") {
throw new Error(
'X-axis value in row ' + (rowIndex + 2) +
' is not numeric: "' + row[0] + '".'
);
}
});
}
candidates.push(chartReadyRows(converted));
} catch (error) {
conversionError = error;
}
});
if (candidates.length > 1) {
throw new Error("Unsiloed returned more than one chart-ready table.");
}
if (candidates.length === 1) return candidates[0];
if (conversionError) throw conversionError;
throw new Error("Unsiloed did not return a chart data table.");
}
function markdownTables(markdown) {
const lines = markdown.split(/\r?\n/);
const tables = [];
for (let index = 0; index < lines.length - 1; index += 1) {
const header = splitMarkdownRow(lines[index]);
const separator = splitMarkdownRow(lines[index + 1]);
if (
header.length < 2 ||
separator.length !== header.length ||
!separator.every(cell => /^:?-+:?$/.test(cell))
) {
continue;
}
const width = header.length;
const rows = [header];
index += 2;
while (index < lines.length && isMarkdownRow(lines[index])) {
const row = splitMarkdownRow(lines[index]);
if (row.length > width) {
throw new Error("A Markdown data row has more cells than its header.");
}
rows.push(row.concat(Array(width - row.length).fill("")));
index += 1;
}
if (rows.length > 1) tables.push(rows);
index -= 1;
}
return tables;
}
function isMarkdownRow(line) {
return splitMarkdownRow(line).length > 1;
}
function splitMarkdownRow(line) {
let body = String(line || "").trim();
if (body.charAt(0) === "|") body = body.slice(1);
if (endsWithUnescapedPipe(body)) body = body.slice(0, -1);
const cells = [];
let cell = "";
for (let index = 0; index < body.length; index += 1) {
const character = body.charAt(index);
const next = body.charAt(index + 1);
if (character === "\\" && next && isMarkdownEscapable(next)) {
cell += next;
index += 1;
} else if (character === "|") {
cells.push(cleanMarkdownCell(cell));
cell = "";
} else {
cell += character;
}
}
cells.push(cleanMarkdownCell(cell));
return cells;
}
function endsWithUnescapedPipe(text) {
if (text.charAt(text.length - 1) !== "|") return false;
let backslashes = 0;
for (
let index = text.length - 2;
index >= 0 && text.charAt(index) === "\\";
index -= 1
) {
backslashes += 1;
}
return backslashes % 2 === 0;
}
function isMarkdownEscapable(character) {
const code = character.charCodeAt(0);
return (
(code >= 33 && code <= 47) ||
(code >= 58 && code <= 64) ||
(code >= 91 && code <= 96) ||
(code >= 123 && code <= 126)
);
}
function cleanMarkdownCell(cell) {
return cell.trim()
.replace(/^\*\*(.*)\*\*$/, "$1")
.replace(/`([^`]*)`/g, "$1");
}
function chartReadyRows(rows) {
const columns = [0];
for (let column = 1; column < rows[0].length; column += 1) {
const values = rows.slice(1).map(row => row[column]);
const populated = values.filter(value => value !== "");
const numeric = populated.filter(value => typeof value === "number");
if (populated.length === 0) {
throw new Error(
'Column "' + (rows[0][column] || column + 1) + '" has no values.'
);
}
if (numeric.length !== populated.length) {
const invalid = populated.find(value => typeof value !== "number");
throw new Error(
'Column "' + (rows[0][column] || column + 1) +
'" contains a nonnumeric value: "' + invalid + '".'
);
}
columns.push(column);
}
if (columns.length === 1) {
throw new Error("Unsiloed returned no numeric chart series.");
}
return rows.map(row => columns.map(column => row[column]));
}
function chartValue(cell) {
const value = cell.trim();
if (!value) return "";
const normalized = value.replace(/\u2212/g, "-");
const looksNumeric = /^[+-]?(?:\d[\d.,]*|\.\d+)(?:e[+-]?\d+)?$/i
.test(normalized);
if (looksNumeric && normalized.indexOf(",") !== -1) {
throw new Error('Numeric cell "' + value + '" contains a comma.');
}
if (!/^[+-]?(?:\d+\.?\d*|\.\d+)(?:e[+-]?\d+)?$/i.test(normalized)) {
return value;
}
const number = Number(normalized);
if (!Number.isFinite(number)) {
throw new Error('Numeric cell "' + value + '" is outside the supported range.');
}
if (Number.isInteger(number) && !Number.isSafeInteger(number)) {
throw new Error('Integer cell "' + value + '" cannot be represented exactly.');
}
return number;
}
```
## Requirements for the Custom Function
Before you start, gather:
* A Google account and a spreadsheet you can edit
* An Unsiloed API key from the [Unsiloed dashboard](https://app.unsiloed.ai)
* A public PNG, JPEG, or TIFF URL that returns the image bytes
A private Google Drive sharing link doesn't work because the custom function
can't use an interactive download page. Use a direct public URL or a presigned
cloud-storage URL.
This guide uses the synthetic D11 dual-axis chart from the Unsiloed
[ChartParse-Bench dataset](https://huggingface.co/datasets/Unsiloed/chart-parse-bench),
published under CC BY 4.0. The dataset accompanies the [chart-parsing benchmark
article](https://www.unsiloed.ai/blog/unsiloed-achieves-sota-chart-parsing):
```text theme={null}
https://huggingface.co/datasets/Unsiloed/chart-parse-bench/resolve/ba7316eb4c398963163b8f2d21d97142db1d8ce6/images/D11.png
```
## Step 1: Open the Apps Script Editor
The custom function lives in the Apps Script project attached to the
spreadsheet.
In Google Sheets, choose **Extensions → Apps Script**.
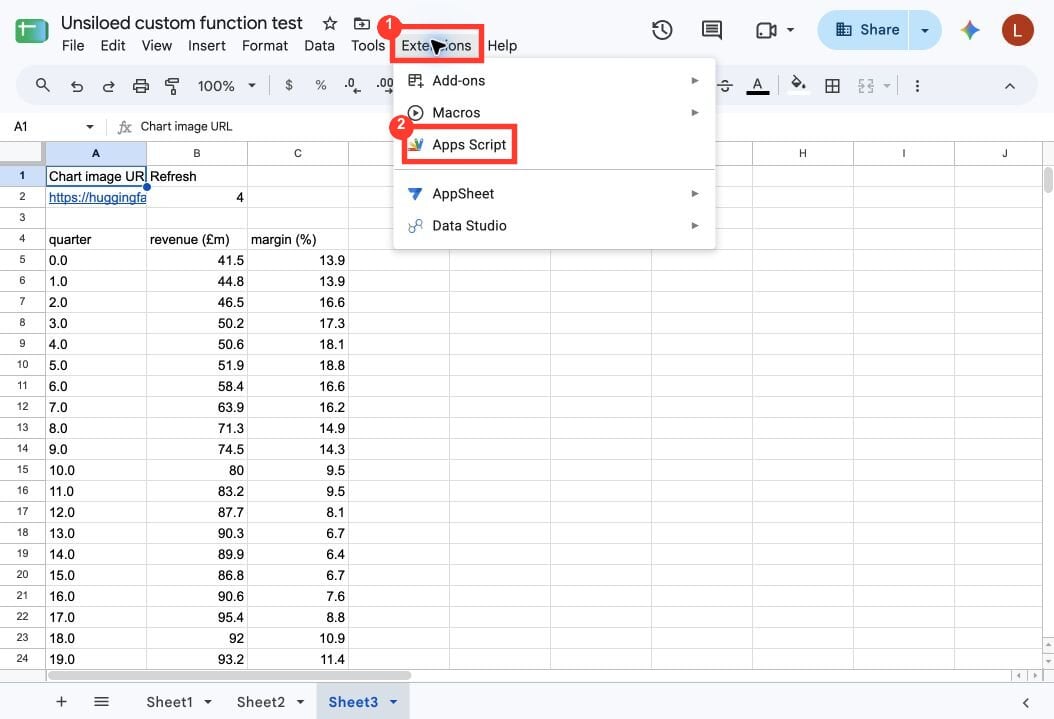 Google creates a bound script project and opens `Code.gs` in a new tab. Delete
the empty `myFunction` that Google adds to a new project.
## Step 2: Build the Custom Function
We'll build the same script in twelve focused sections. Keep each addition in
`Code.gs` in the order shown below. If you copied the completed script from the
accordion, use this section to understand its request, cache, and
table-conversion logic.
### 2.1 Configure Chart Extraction
At the top of `Code.gs`, add the API URL, cache limits, extraction prompt, and
API key helper:
```javascript Code.gs theme={null}
const UNSILOED_BASE_URL = "https://prod.visionapi.unsiloed.ai";
const UNSILOED_JOB_MAX_AGE_MS = 24 * 60 * 60 * 1000;
const UNSILOED_MAX_CACHED_JOBS = 50;
const UNSILOED_JOB_VERSION = "chart-v6";
const UNSILOED_JOB_PREFIX = "UNSILOED_JOB_";
const UNSILOED_CHART_PROMPT = [
"Extract every visible chart data point.",
"Preserve category labels, series names, and units exactly.",
"End with exactly one Markdown table.",
"Put category or x-axis values in the first column",
"and numeric series encoded by chart marks in the remaining columns.",
"Do not add columns that only repeat plotted values as text, rankings, annotations,",
"or derived comparisons.",
"Every data row must contain the plotted value when it is visible.",
"Include visible units in series headers.",
"Keep values on multiple axes in their original units.",
"For visible error bars, add numeric x error and y error columns.",
"Use an empty cell only for a genuinely missing value.",
"Use a period as the decimal separator.",
"Do not put units or grouping separators in numeric cells."
].join(" ");
function unsiloedApiKey() {
const apiKey = PropertiesService.getScriptProperties()
.getProperty("UNSILOED_API_KEY");
if (!apiKey) throw new Error("Add UNSILOED_API_KEY to the script properties.");
return apiKey;
}
```
The prompt asks for one rectangular table with canonical numeric cells. It also
keeps multi-axis values in their original units and preserves visible error bars
as separate columns. The job version and API-key fingerprint become part of the
cache key. We'll add `UNSILOED_API_KEY` in
[Step 3](#step-3-store-your-api-key).
### 2.2 Check the Parse Job
Below `unsiloedApiKey`, add the function that Sheets calls:
```javascript Code.gs theme={null}
/**
* Extracts chart data from a public image URL.
*
* @param {string} imageUrl A public PNG, JPEG, or TIFF URL.
* @param {*} refresh Change this value to check an unfinished job again.
* @param {boolean} numericX Use TRUE to return a numeric first column.
* @return {Array>} Chart-ready data.
* @customfunction
*/
function UNSILOED_CHART(imageUrl, refresh, numericX) {
void refresh;
if (Array.isArray(imageUrl)) imageUrl = imageUrl[0][0];
imageUrl = String(imageUrl || "").trim();
if (!/^https?:\/\//i.test(imageUrl)) {
throw new Error("Pass a public HTTP image URL.");
}
const apiKey = unsiloedApiKey();
const jobId = getOrCreateChartJob(imageUrl, apiKey);
let job;
try {
job = unsiloedRequest(
"/parse/" + encodeURIComponent(jobId),
apiKey
);
} catch (error) {
if (error.httpStatus === 404) {
const cleared = clearCachedChartJob(imageUrl, apiKey, jobId);
const action = cleared
? "The saved job was cleared. Change the refresh value to submit it again."
: "Change the refresh value to try again.";
throw new Error("The saved parse job no longer exists. " + action);
}
throw error;
}
if (job.status === "Succeeded") {
return firstChartRows(job, numericX === true);
}
if (job.status === "Failed" || job.status === "Cancelled") {
const cleared = clearCachedChartJob(imageUrl, apiKey, jobId);
const action = cleared
? "The saved job was cleared. Change the refresh value to submit it again."
: "Change the refresh value to try again.";
throw new Error(
(job.message || "Parsing " + job.status.toLowerCase() + ".") + " " + action
);
}
return [["Still processing. Change the refresh value to check again."]];
}
```
The `@customfunction` tag adds `UNSILOED_CHART` to Sheets autocomplete. Each
calculation performs one status request. If the job is still running, changing
`refresh` starts another calculation that checks the saved job ID.
### 2.3 Reuse or Create a Parse Job
Below `UNSILOED_CHART`, add the helper that reads the cache before taking a lock,
then checks it again before submitting an image:
```javascript Code.gs theme={null}
function getOrCreateChartJob(imageUrl, apiKey) {
const properties = PropertiesService.getScriptProperties();
const propertyName = jobPropertyName(imageUrl, apiKey);
const cached = readCachedChartJob(properties, propertyName);
if (cached) return cached.jobId;
const lock = LockService.getScriptLock();
if (!lock.tryLock(5000)) throw new Error("Try the formula again.");
try {
const checkedAgain = readCachedChartJob(properties, propertyName);
if (checkedAgain) return checkedAgain.jobId;
pruneChartJobs(properties);
const image = fetchChartImage(imageUrl);
const started = unsiloedRequest("/parse", apiKey, {
method: "post",
payload: chartParsePayload(image)
});
if (typeof started.job_id !== "string" || !started.job_id) {
throw new Error("Unsiloed returned no job ID.");
}
properties.setProperty(propertyName, JSON.stringify({
jobId: started.job_id,
createdAt: Date.now()
}));
return started.job_id;
} finally {
lock.releaseLock();
}
}
```
Reading before locking lets an existing job return immediately. The second read
prevents two simultaneous calculations from creating ordinary duplicate jobs.
A remote job accepted immediately before Apps Script terminates may still lose
its ID because the parse API doesn't expose an idempotency key.
### 2.4 Validate and Clear Cached Jobs
Below `getOrCreateChartJob`, add helpers that reject malformed cache entries and
remove a failed or missing job without deleting a newer replacement:
```javascript Code.gs theme={null}
function readCachedChartJob(properties, propertyName) {
const saved = properties.getProperty(propertyName);
if (!saved) return null;
try {
const state = JSON.parse(saved);
const age = Date.now() - state.createdAt;
if (
typeof state.jobId === "string" &&
state.jobId &&
Number.isFinite(state.createdAt) &&
age >= 0 &&
age < UNSILOED_JOB_MAX_AGE_MS
) {
return state;
}
} catch (error) {
// Invalid entries are removed during the next locked cleanup.
}
return null;
}
function clearCachedChartJob(imageUrl, apiKey, jobId) {
const properties = PropertiesService.getScriptProperties();
const propertyName = jobPropertyName(imageUrl, apiKey);
const lock = LockService.getScriptLock();
if (!lock.tryLock(5000)) return false;
try {
const saved = properties.getProperty(propertyName);
if (!saved) return true;
try {
const state = JSON.parse(saved);
if (state.jobId !== jobId) return false;
} catch (error) {
// The matching property is unusable and can be removed.
}
properties.deleteProperty(propertyName);
return true;
} finally {
lock.releaseLock();
}
}
```
The job ID comparison matters when concurrent calculations overlap. It prevents
an old failed response from removing a newer job saved under the same key.
### 2.5 Bound the Job Cache
Below `clearCachedChartJob`, add cleanup and cache-key helpers:
```javascript Code.gs theme={null}
function pruneChartJobs(properties) {
const all = properties.getProperties();
const now = Date.now();
const valid = [];
Object.keys(all).forEach(key => {
if (key.indexOf(UNSILOED_JOB_PREFIX) !== 0) return;
try {
const state = JSON.parse(all[key]);
const age = now - state.createdAt;
if (
typeof state.jobId === "string" &&
state.jobId &&
Number.isFinite(state.createdAt) &&
age >= 0 &&
age < UNSILOED_JOB_MAX_AGE_MS
) {
valid.push({ key: key, createdAt: state.createdAt });
}
} catch (error) {
// Invalid entries are excluded from the retained set.
}
});
valid.sort((a, b) => b.createdAt - a.createdAt);
const retained = new Set(
valid.slice(0, Math.max(UNSILOED_MAX_CACHED_JOBS - 1, 0))
.map(entry => entry.key)
);
Object.keys(all).forEach(key => {
if (
key.indexOf(UNSILOED_JOB_PREFIX) === 0 &&
!retained.has(key)
) {
properties.deleteProperty(key);
}
});
}
function jobPropertyName(imageUrl, apiKey) {
const digest = Utilities.computeDigest(
Utilities.DigestAlgorithm.SHA_256,
UNSILOED_JOB_VERSION + "\n" + imageUrl + "\n" + apiKey,
Utilities.Charset.UTF_8
);
const hex = digest.map(byte =>
(byte + 256).toString(16).slice(-2)
).join("");
return UNSILOED_JOB_PREFIX + hex;
}
```
Cleanup retains at most 50 current jobs and removes expired, malformed, and
older entries. Hashing the API key into the property name starts a new cache when
the spreadsheet changes Unsiloed accounts without exposing the key.
### 2.6 Build the Chart Parse Request
Below `jobPropertyName`, add the payload that tells Unsiloed how to analyze the
image and which response fields to return:
```javascript Code.gs theme={null}
function chartParsePayload(image) {
const segmentAnalysis = {
Page: {
markdown: "VLM",
model_id: "nova",
vlm: UNSILOED_CHART_PROMPT
}
};
const outputFields = {
html: false,
markdown: true,
ocr: false,
image: false,
content: false,
bbox: false,
confidence: false,
embed: false,
chart_data: false
};
return {
file: image,
use_high_resolution: "true",
layout_analysis: "page_by_page",
segment_analysis: JSON.stringify(segmentAnalysis),
response_profile: "custom",
output_fields: JSON.stringify(outputFields)
};
}
```
The page analyzer sees the complete standalone chart, including its labels and
axes. Because the image is one chart, the whole page is the chart, and the prompt
controls the shape of the table that comes back. The custom response profile
returns the Markdown table the sheet needs and omits fields the formula doesn't
use.
The request turns off `chart_data` because the prompt already produces the
table. For charts embedded in multi-page documents, send `extract_charts=true`
instead and read the structured `chart_data` field on each chart segment. See
the [parse job response reference](/docs/api-reference/parser/get-parse-job-status)
for that field.
### 2.7 Download the Source Image
Below `chartParsePayload`, add the image downloader:
```javascript Code.gs theme={null}
function fetchChartImage(imageUrl) {
const response = UrlFetchApp.fetch(imageUrl, {
followRedirects: true,
muteHttpExceptions: true
});
const status = response.getResponseCode();
if (status < 200 || status >= 300) {
throw new Error("The image URL returned HTTP " + status + ".");
}
const image = response.getBlob();
if (!/^image\//i.test(image.getContentType())) {
throw new Error("The URL did not return an image.");
}
const path = imageUrl.split(/[?#]/)[0];
const fileName = path.substring(path.lastIndexOf("/") + 1) || "chart.png";
return image.setName(fileName);
}
```
Downloading in Apps Script ensures Unsiloed receives image bytes and the correct
content type. Apps Script doesn't expose a per-request fetch timeout, so a slow
download or API request can still reach the custom function's runtime limit.
### 2.8 Send Authenticated API Requests
Below `fetchChartImage`, add the shared request helper:
```javascript Code.gs theme={null}
function unsiloedRequest(path, apiKey, options) {
const requestOptions = options || {};
const response = UrlFetchApp.fetch(UNSILOED_BASE_URL + path, {
muteHttpExceptions: true,
...requestOptions,
headers: {
...(requestOptions.headers || {}),
"api-key": apiKey
}
});
const text = response.getContentText();
const status = response.getResponseCode();
if (status >= 200 && status < 300) return JSON.parse(text);
let message = text;
try {
const body = JSON.parse(text);
message = body.error?.message || body.message || body.detail || text;
} catch (error) {
// Keep the plain-text response.
}
const requestError = new Error(
message || "Unsiloed returned HTTP " + status + "."
);
requestError.httpStatus = status;
throw requestError;
}
```
The helper adds the API key and surfaces API error messages in the formula cell.
It also preserves the HTTP status so the main function can clear a missing job
without treating temporary server errors as permanent.
### 2.9 Select the Chart Data Table
Below `unsiloedRequest`, add the helper that validates every extracted table:
```javascript Code.gs theme={null}
function firstChartRows(job, numericX) {
const tables = (job.chunks || [])
.flatMap(chunk => chunk.segments || [])
.flatMap(segment => markdownTables(segment.markdown || ""));
const candidates = [];
let conversionError = null;
tables.forEach(rows => {
if (rows.length < 2 || rows[0].length < 2) return;
try {
const converted = rows.map((row, rowIndex) => row.map(
(cell, columnIndex) =>
rowIndex === 0 || (columnIndex === 0 && !numericX)
? cell
: chartValue(cell)
));
if (numericX) {
converted.slice(1).forEach((row, rowIndex) => {
if (typeof row[0] !== "number") {
throw new Error(
'X-axis value in row ' + (rowIndex + 2) +
' is not numeric: "' + row[0] + '".'
);
}
});
}
candidates.push(chartReadyRows(converted));
} catch (error) {
conversionError = error;
}
});
if (candidates.length > 1) {
throw new Error("Unsiloed returned more than one chart-ready table.");
}
if (candidates.length === 1) return candidates[0];
if (conversionError) throw conversionError;
throw new Error("Unsiloed did not return a chart data table.");
}
```
The function accepts a table only after numeric-series validation. It preserves
the first column as text by default, protecting numeric-looking category labels.
Pass `TRUE` as the optional third formula argument when a scatter chart needs a
numeric x-axis. In that mode, a missing or nonnumeric x value produces an error.
### 2.10 Parse Markdown Tables
Below `firstChartRows`, add the tolerant Markdown table parser:
```javascript Code.gs theme={null}
function markdownTables(markdown) {
const lines = markdown.split(/\r?\n/);
const tables = [];
for (let index = 0; index < lines.length - 1; index += 1) {
const header = splitMarkdownRow(lines[index]);
const separator = splitMarkdownRow(lines[index + 1]);
if (
header.length < 2 ||
separator.length !== header.length ||
!separator.every(cell => /^:?-+:?$/.test(cell))
) {
continue;
}
const width = header.length;
const rows = [header];
index += 2;
while (index < lines.length && isMarkdownRow(lines[index])) {
const row = splitMarkdownRow(lines[index]);
if (row.length > width) {
throw new Error("A Markdown data row has more cells than its header.");
}
rows.push(row.concat(Array(width - row.length).fill("")));
index += 1;
}
if (rows.length > 1) tables.push(rows);
index -= 1;
}
return tables;
}
function isMarkdownRow(line) {
return splitMarkdownRow(line).length > 1;
}
```
The parser accepts tables with or without outside pipes, verifies that the
header and delimiter widths match, and pads short data rows into a rectangular
array. It rejects wider rows because an extra pipe could otherwise shift or
hide a value.
### 2.11 Split Markdown Cells Safely
Below `isMarkdownRow`, add the row parser and backslash helpers:
```javascript Code.gs theme={null}
function splitMarkdownRow(line) {
let body = String(line || "").trim();
if (body.charAt(0) === "|") body = body.slice(1);
if (endsWithUnescapedPipe(body)) body = body.slice(0, -1);
const cells = [];
let cell = "";
for (let index = 0; index < body.length; index += 1) {
const character = body.charAt(index);
const next = body.charAt(index + 1);
if (character === "\\" && next && isMarkdownEscapable(next)) {
cell += next;
index += 1;
} else if (character === "|") {
cells.push(cleanMarkdownCell(cell));
cell = "";
} else {
cell += character;
}
}
cells.push(cleanMarkdownCell(cell));
return cells;
}
function endsWithUnescapedPipe(text) {
if (text.charAt(text.length - 1) !== "|") return false;
let backslashes = 0;
for (
let index = text.length - 2;
index >= 0 && text.charAt(index) === "\\";
index -= 1
) {
backslashes += 1;
}
return backslashes % 2 === 0;
}
function isMarkdownEscapable(character) {
const code = character.charCodeAt(0);
return (
(code >= 33 && code <= 47) ||
(code >= 58 && code <= 64) ||
(code >= 91 && code <= 96) ||
(code >= 123 && code <= 126)
);
}
function cleanMarkdownCell(cell) {
return cell.trim()
.replace(/^\*\*(.*)\*\*$/, "$1")
.replace(/`([^`]*)`/g, "$1");
}
```
Only punctuation consumes a Markdown backslash escape. Ordinary text such as
`C:\temp` keeps its literal backslash, while `\|` remains a pipe inside its
cell.
### 2.12 Validate Series and Numbers
At the bottom of `Code.gs`, add the numeric-series and cell-value validators:
```javascript Code.gs theme={null}
function chartReadyRows(rows) {
const columns = [0];
for (let column = 1; column < rows[0].length; column += 1) {
const values = rows.slice(1).map(row => row[column]);
const populated = values.filter(value => value !== "");
const numeric = populated.filter(value => typeof value === "number");
if (populated.length === 0) {
throw new Error(
'Column "' + (rows[0][column] || column + 1) + '" has no values.'
);
}
if (numeric.length !== populated.length) {
const invalid = populated.find(value => typeof value !== "number");
throw new Error(
'Column "' + (rows[0][column] || column + 1) +
'" contains a nonnumeric value: "' + invalid + '".'
);
}
columns.push(column);
}
if (columns.length === 1) {
throw new Error("Unsiloed returned no numeric chart series.");
}
return rows.map(row => columns.map(column => row[column]));
}
function chartValue(cell) {
const value = cell.trim();
if (!value) return "";
const normalized = value.replace(/\u2212/g, "-");
const looksNumeric = /^[+-]?(?:\d[\d.,]*|\.\d+)(?:e[+-]?\d+)?$/i
.test(normalized);
if (looksNumeric && normalized.indexOf(",") !== -1) {
throw new Error('Numeric cell "' + value + '" contains a comma.');
}
if (!/^[+-]?(?:\d+\.?\d*|\.\d+)(?:e[+-]?\d+)?$/i.test(normalized)) {
return value;
}
const number = Number(normalized);
if (!Number.isFinite(number)) {
throw new Error('Numeric cell "' + value + '" is outside the supported range.');
}
if (Number.isInteger(number) && !Number.isSafeInteger(number)) {
throw new Error('Integer cell "' + value + '" cannot be represented exactly.');
}
return number;
}
```
Every returned series must contain numeric values. Empty, text-only, and mixed
numeric/text columns fail with the column name and offending value instead of
disappearing silently. Equal numeric series remain separate, and numeric
overflow or unsafe integers produce an error rather than a corrupted
spreadsheet value.
When `Code.gs` contains all twelve sections, save the project and confirm that
Apps Script reports no syntax error. The finished script should use the
`chart-v6` cache version and accept `imageUrl`, `refresh`, and `numericX` as
the function's three arguments.
Google creates a bound script project and opens `Code.gs` in a new tab. Delete
the empty `myFunction` that Google adds to a new project.
## Step 2: Build the Custom Function
We'll build the same script in twelve focused sections. Keep each addition in
`Code.gs` in the order shown below. If you copied the completed script from the
accordion, use this section to understand its request, cache, and
table-conversion logic.
### 2.1 Configure Chart Extraction
At the top of `Code.gs`, add the API URL, cache limits, extraction prompt, and
API key helper:
```javascript Code.gs theme={null}
const UNSILOED_BASE_URL = "https://prod.visionapi.unsiloed.ai";
const UNSILOED_JOB_MAX_AGE_MS = 24 * 60 * 60 * 1000;
const UNSILOED_MAX_CACHED_JOBS = 50;
const UNSILOED_JOB_VERSION = "chart-v6";
const UNSILOED_JOB_PREFIX = "UNSILOED_JOB_";
const UNSILOED_CHART_PROMPT = [
"Extract every visible chart data point.",
"Preserve category labels, series names, and units exactly.",
"End with exactly one Markdown table.",
"Put category or x-axis values in the first column",
"and numeric series encoded by chart marks in the remaining columns.",
"Do not add columns that only repeat plotted values as text, rankings, annotations,",
"or derived comparisons.",
"Every data row must contain the plotted value when it is visible.",
"Include visible units in series headers.",
"Keep values on multiple axes in their original units.",
"For visible error bars, add numeric x error and y error columns.",
"Use an empty cell only for a genuinely missing value.",
"Use a period as the decimal separator.",
"Do not put units or grouping separators in numeric cells."
].join(" ");
function unsiloedApiKey() {
const apiKey = PropertiesService.getScriptProperties()
.getProperty("UNSILOED_API_KEY");
if (!apiKey) throw new Error("Add UNSILOED_API_KEY to the script properties.");
return apiKey;
}
```
The prompt asks for one rectangular table with canonical numeric cells. It also
keeps multi-axis values in their original units and preserves visible error bars
as separate columns. The job version and API-key fingerprint become part of the
cache key. We'll add `UNSILOED_API_KEY` in
[Step 3](#step-3-store-your-api-key).
### 2.2 Check the Parse Job
Below `unsiloedApiKey`, add the function that Sheets calls:
```javascript Code.gs theme={null}
/**
* Extracts chart data from a public image URL.
*
* @param {string} imageUrl A public PNG, JPEG, or TIFF URL.
* @param {*} refresh Change this value to check an unfinished job again.
* @param {boolean} numericX Use TRUE to return a numeric first column.
* @return {Array>} Chart-ready data.
* @customfunction
*/
function UNSILOED_CHART(imageUrl, refresh, numericX) {
void refresh;
if (Array.isArray(imageUrl)) imageUrl = imageUrl[0][0];
imageUrl = String(imageUrl || "").trim();
if (!/^https?:\/\//i.test(imageUrl)) {
throw new Error("Pass a public HTTP image URL.");
}
const apiKey = unsiloedApiKey();
const jobId = getOrCreateChartJob(imageUrl, apiKey);
let job;
try {
job = unsiloedRequest(
"/parse/" + encodeURIComponent(jobId),
apiKey
);
} catch (error) {
if (error.httpStatus === 404) {
const cleared = clearCachedChartJob(imageUrl, apiKey, jobId);
const action = cleared
? "The saved job was cleared. Change the refresh value to submit it again."
: "Change the refresh value to try again.";
throw new Error("The saved parse job no longer exists. " + action);
}
throw error;
}
if (job.status === "Succeeded") {
return firstChartRows(job, numericX === true);
}
if (job.status === "Failed" || job.status === "Cancelled") {
const cleared = clearCachedChartJob(imageUrl, apiKey, jobId);
const action = cleared
? "The saved job was cleared. Change the refresh value to submit it again."
: "Change the refresh value to try again.";
throw new Error(
(job.message || "Parsing " + job.status.toLowerCase() + ".") + " " + action
);
}
return [["Still processing. Change the refresh value to check again."]];
}
```
The `@customfunction` tag adds `UNSILOED_CHART` to Sheets autocomplete. Each
calculation performs one status request. If the job is still running, changing
`refresh` starts another calculation that checks the saved job ID.
### 2.3 Reuse or Create a Parse Job
Below `UNSILOED_CHART`, add the helper that reads the cache before taking a lock,
then checks it again before submitting an image:
```javascript Code.gs theme={null}
function getOrCreateChartJob(imageUrl, apiKey) {
const properties = PropertiesService.getScriptProperties();
const propertyName = jobPropertyName(imageUrl, apiKey);
const cached = readCachedChartJob(properties, propertyName);
if (cached) return cached.jobId;
const lock = LockService.getScriptLock();
if (!lock.tryLock(5000)) throw new Error("Try the formula again.");
try {
const checkedAgain = readCachedChartJob(properties, propertyName);
if (checkedAgain) return checkedAgain.jobId;
pruneChartJobs(properties);
const image = fetchChartImage(imageUrl);
const started = unsiloedRequest("/parse", apiKey, {
method: "post",
payload: chartParsePayload(image)
});
if (typeof started.job_id !== "string" || !started.job_id) {
throw new Error("Unsiloed returned no job ID.");
}
properties.setProperty(propertyName, JSON.stringify({
jobId: started.job_id,
createdAt: Date.now()
}));
return started.job_id;
} finally {
lock.releaseLock();
}
}
```
Reading before locking lets an existing job return immediately. The second read
prevents two simultaneous calculations from creating ordinary duplicate jobs.
A remote job accepted immediately before Apps Script terminates may still lose
its ID because the parse API doesn't expose an idempotency key.
### 2.4 Validate and Clear Cached Jobs
Below `getOrCreateChartJob`, add helpers that reject malformed cache entries and
remove a failed or missing job without deleting a newer replacement:
```javascript Code.gs theme={null}
function readCachedChartJob(properties, propertyName) {
const saved = properties.getProperty(propertyName);
if (!saved) return null;
try {
const state = JSON.parse(saved);
const age = Date.now() - state.createdAt;
if (
typeof state.jobId === "string" &&
state.jobId &&
Number.isFinite(state.createdAt) &&
age >= 0 &&
age < UNSILOED_JOB_MAX_AGE_MS
) {
return state;
}
} catch (error) {
// Invalid entries are removed during the next locked cleanup.
}
return null;
}
function clearCachedChartJob(imageUrl, apiKey, jobId) {
const properties = PropertiesService.getScriptProperties();
const propertyName = jobPropertyName(imageUrl, apiKey);
const lock = LockService.getScriptLock();
if (!lock.tryLock(5000)) return false;
try {
const saved = properties.getProperty(propertyName);
if (!saved) return true;
try {
const state = JSON.parse(saved);
if (state.jobId !== jobId) return false;
} catch (error) {
// The matching property is unusable and can be removed.
}
properties.deleteProperty(propertyName);
return true;
} finally {
lock.releaseLock();
}
}
```
The job ID comparison matters when concurrent calculations overlap. It prevents
an old failed response from removing a newer job saved under the same key.
### 2.5 Bound the Job Cache
Below `clearCachedChartJob`, add cleanup and cache-key helpers:
```javascript Code.gs theme={null}
function pruneChartJobs(properties) {
const all = properties.getProperties();
const now = Date.now();
const valid = [];
Object.keys(all).forEach(key => {
if (key.indexOf(UNSILOED_JOB_PREFIX) !== 0) return;
try {
const state = JSON.parse(all[key]);
const age = now - state.createdAt;
if (
typeof state.jobId === "string" &&
state.jobId &&
Number.isFinite(state.createdAt) &&
age >= 0 &&
age < UNSILOED_JOB_MAX_AGE_MS
) {
valid.push({ key: key, createdAt: state.createdAt });
}
} catch (error) {
// Invalid entries are excluded from the retained set.
}
});
valid.sort((a, b) => b.createdAt - a.createdAt);
const retained = new Set(
valid.slice(0, Math.max(UNSILOED_MAX_CACHED_JOBS - 1, 0))
.map(entry => entry.key)
);
Object.keys(all).forEach(key => {
if (
key.indexOf(UNSILOED_JOB_PREFIX) === 0 &&
!retained.has(key)
) {
properties.deleteProperty(key);
}
});
}
function jobPropertyName(imageUrl, apiKey) {
const digest = Utilities.computeDigest(
Utilities.DigestAlgorithm.SHA_256,
UNSILOED_JOB_VERSION + "\n" + imageUrl + "\n" + apiKey,
Utilities.Charset.UTF_8
);
const hex = digest.map(byte =>
(byte + 256).toString(16).slice(-2)
).join("");
return UNSILOED_JOB_PREFIX + hex;
}
```
Cleanup retains at most 50 current jobs and removes expired, malformed, and
older entries. Hashing the API key into the property name starts a new cache when
the spreadsheet changes Unsiloed accounts without exposing the key.
### 2.6 Build the Chart Parse Request
Below `jobPropertyName`, add the payload that tells Unsiloed how to analyze the
image and which response fields to return:
```javascript Code.gs theme={null}
function chartParsePayload(image) {
const segmentAnalysis = {
Page: {
markdown: "VLM",
model_id: "nova",
vlm: UNSILOED_CHART_PROMPT
}
};
const outputFields = {
html: false,
markdown: true,
ocr: false,
image: false,
content: false,
bbox: false,
confidence: false,
embed: false,
chart_data: false
};
return {
file: image,
use_high_resolution: "true",
layout_analysis: "page_by_page",
segment_analysis: JSON.stringify(segmentAnalysis),
response_profile: "custom",
output_fields: JSON.stringify(outputFields)
};
}
```
The page analyzer sees the complete standalone chart, including its labels and
axes. Because the image is one chart, the whole page is the chart, and the prompt
controls the shape of the table that comes back. The custom response profile
returns the Markdown table the sheet needs and omits fields the formula doesn't
use.
The request turns off `chart_data` because the prompt already produces the
table. For charts embedded in multi-page documents, send `extract_charts=true`
instead and read the structured `chart_data` field on each chart segment. See
the [parse job response reference](/docs/api-reference/parser/get-parse-job-status)
for that field.
### 2.7 Download the Source Image
Below `chartParsePayload`, add the image downloader:
```javascript Code.gs theme={null}
function fetchChartImage(imageUrl) {
const response = UrlFetchApp.fetch(imageUrl, {
followRedirects: true,
muteHttpExceptions: true
});
const status = response.getResponseCode();
if (status < 200 || status >= 300) {
throw new Error("The image URL returned HTTP " + status + ".");
}
const image = response.getBlob();
if (!/^image\//i.test(image.getContentType())) {
throw new Error("The URL did not return an image.");
}
const path = imageUrl.split(/[?#]/)[0];
const fileName = path.substring(path.lastIndexOf("/") + 1) || "chart.png";
return image.setName(fileName);
}
```
Downloading in Apps Script ensures Unsiloed receives image bytes and the correct
content type. Apps Script doesn't expose a per-request fetch timeout, so a slow
download or API request can still reach the custom function's runtime limit.
### 2.8 Send Authenticated API Requests
Below `fetchChartImage`, add the shared request helper:
```javascript Code.gs theme={null}
function unsiloedRequest(path, apiKey, options) {
const requestOptions = options || {};
const response = UrlFetchApp.fetch(UNSILOED_BASE_URL + path, {
muteHttpExceptions: true,
...requestOptions,
headers: {
...(requestOptions.headers || {}),
"api-key": apiKey
}
});
const text = response.getContentText();
const status = response.getResponseCode();
if (status >= 200 && status < 300) return JSON.parse(text);
let message = text;
try {
const body = JSON.parse(text);
message = body.error?.message || body.message || body.detail || text;
} catch (error) {
// Keep the plain-text response.
}
const requestError = new Error(
message || "Unsiloed returned HTTP " + status + "."
);
requestError.httpStatus = status;
throw requestError;
}
```
The helper adds the API key and surfaces API error messages in the formula cell.
It also preserves the HTTP status so the main function can clear a missing job
without treating temporary server errors as permanent.
### 2.9 Select the Chart Data Table
Below `unsiloedRequest`, add the helper that validates every extracted table:
```javascript Code.gs theme={null}
function firstChartRows(job, numericX) {
const tables = (job.chunks || [])
.flatMap(chunk => chunk.segments || [])
.flatMap(segment => markdownTables(segment.markdown || ""));
const candidates = [];
let conversionError = null;
tables.forEach(rows => {
if (rows.length < 2 || rows[0].length < 2) return;
try {
const converted = rows.map((row, rowIndex) => row.map(
(cell, columnIndex) =>
rowIndex === 0 || (columnIndex === 0 && !numericX)
? cell
: chartValue(cell)
));
if (numericX) {
converted.slice(1).forEach((row, rowIndex) => {
if (typeof row[0] !== "number") {
throw new Error(
'X-axis value in row ' + (rowIndex + 2) +
' is not numeric: "' + row[0] + '".'
);
}
});
}
candidates.push(chartReadyRows(converted));
} catch (error) {
conversionError = error;
}
});
if (candidates.length > 1) {
throw new Error("Unsiloed returned more than one chart-ready table.");
}
if (candidates.length === 1) return candidates[0];
if (conversionError) throw conversionError;
throw new Error("Unsiloed did not return a chart data table.");
}
```
The function accepts a table only after numeric-series validation. It preserves
the first column as text by default, protecting numeric-looking category labels.
Pass `TRUE` as the optional third formula argument when a scatter chart needs a
numeric x-axis. In that mode, a missing or nonnumeric x value produces an error.
### 2.10 Parse Markdown Tables
Below `firstChartRows`, add the tolerant Markdown table parser:
```javascript Code.gs theme={null}
function markdownTables(markdown) {
const lines = markdown.split(/\r?\n/);
const tables = [];
for (let index = 0; index < lines.length - 1; index += 1) {
const header = splitMarkdownRow(lines[index]);
const separator = splitMarkdownRow(lines[index + 1]);
if (
header.length < 2 ||
separator.length !== header.length ||
!separator.every(cell => /^:?-+:?$/.test(cell))
) {
continue;
}
const width = header.length;
const rows = [header];
index += 2;
while (index < lines.length && isMarkdownRow(lines[index])) {
const row = splitMarkdownRow(lines[index]);
if (row.length > width) {
throw new Error("A Markdown data row has more cells than its header.");
}
rows.push(row.concat(Array(width - row.length).fill("")));
index += 1;
}
if (rows.length > 1) tables.push(rows);
index -= 1;
}
return tables;
}
function isMarkdownRow(line) {
return splitMarkdownRow(line).length > 1;
}
```
The parser accepts tables with or without outside pipes, verifies that the
header and delimiter widths match, and pads short data rows into a rectangular
array. It rejects wider rows because an extra pipe could otherwise shift or
hide a value.
### 2.11 Split Markdown Cells Safely
Below `isMarkdownRow`, add the row parser and backslash helpers:
```javascript Code.gs theme={null}
function splitMarkdownRow(line) {
let body = String(line || "").trim();
if (body.charAt(0) === "|") body = body.slice(1);
if (endsWithUnescapedPipe(body)) body = body.slice(0, -1);
const cells = [];
let cell = "";
for (let index = 0; index < body.length; index += 1) {
const character = body.charAt(index);
const next = body.charAt(index + 1);
if (character === "\\" && next && isMarkdownEscapable(next)) {
cell += next;
index += 1;
} else if (character === "|") {
cells.push(cleanMarkdownCell(cell));
cell = "";
} else {
cell += character;
}
}
cells.push(cleanMarkdownCell(cell));
return cells;
}
function endsWithUnescapedPipe(text) {
if (text.charAt(text.length - 1) !== "|") return false;
let backslashes = 0;
for (
let index = text.length - 2;
index >= 0 && text.charAt(index) === "\\";
index -= 1
) {
backslashes += 1;
}
return backslashes % 2 === 0;
}
function isMarkdownEscapable(character) {
const code = character.charCodeAt(0);
return (
(code >= 33 && code <= 47) ||
(code >= 58 && code <= 64) ||
(code >= 91 && code <= 96) ||
(code >= 123 && code <= 126)
);
}
function cleanMarkdownCell(cell) {
return cell.trim()
.replace(/^\*\*(.*)\*\*$/, "$1")
.replace(/`([^`]*)`/g, "$1");
}
```
Only punctuation consumes a Markdown backslash escape. Ordinary text such as
`C:\temp` keeps its literal backslash, while `\|` remains a pipe inside its
cell.
### 2.12 Validate Series and Numbers
At the bottom of `Code.gs`, add the numeric-series and cell-value validators:
```javascript Code.gs theme={null}
function chartReadyRows(rows) {
const columns = [0];
for (let column = 1; column < rows[0].length; column += 1) {
const values = rows.slice(1).map(row => row[column]);
const populated = values.filter(value => value !== "");
const numeric = populated.filter(value => typeof value === "number");
if (populated.length === 0) {
throw new Error(
'Column "' + (rows[0][column] || column + 1) + '" has no values.'
);
}
if (numeric.length !== populated.length) {
const invalid = populated.find(value => typeof value !== "number");
throw new Error(
'Column "' + (rows[0][column] || column + 1) +
'" contains a nonnumeric value: "' + invalid + '".'
);
}
columns.push(column);
}
if (columns.length === 1) {
throw new Error("Unsiloed returned no numeric chart series.");
}
return rows.map(row => columns.map(column => row[column]));
}
function chartValue(cell) {
const value = cell.trim();
if (!value) return "";
const normalized = value.replace(/\u2212/g, "-");
const looksNumeric = /^[+-]?(?:\d[\d.,]*|\.\d+)(?:e[+-]?\d+)?$/i
.test(normalized);
if (looksNumeric && normalized.indexOf(",") !== -1) {
throw new Error('Numeric cell "' + value + '" contains a comma.');
}
if (!/^[+-]?(?:\d+\.?\d*|\.\d+)(?:e[+-]?\d+)?$/i.test(normalized)) {
return value;
}
const number = Number(normalized);
if (!Number.isFinite(number)) {
throw new Error('Numeric cell "' + value + '" is outside the supported range.');
}
if (Number.isInteger(number) && !Number.isSafeInteger(number)) {
throw new Error('Integer cell "' + value + '" cannot be represented exactly.');
}
return number;
}
```
Every returned series must contain numeric values. Empty, text-only, and mixed
numeric/text columns fail with the column name and offending value instead of
disappearing silently. Equal numeric series remain separate, and numeric
overflow or unsafe integers produce an error rather than a corrupted
spreadsheet value.
When `Code.gs` contains all twelve sections, save the project and confirm that
Apps Script reports no syntax error. The finished script should use the
`chart-v6` cache version and accept `imageUrl`, `refresh`, and `numericX` as
the function's three arguments.
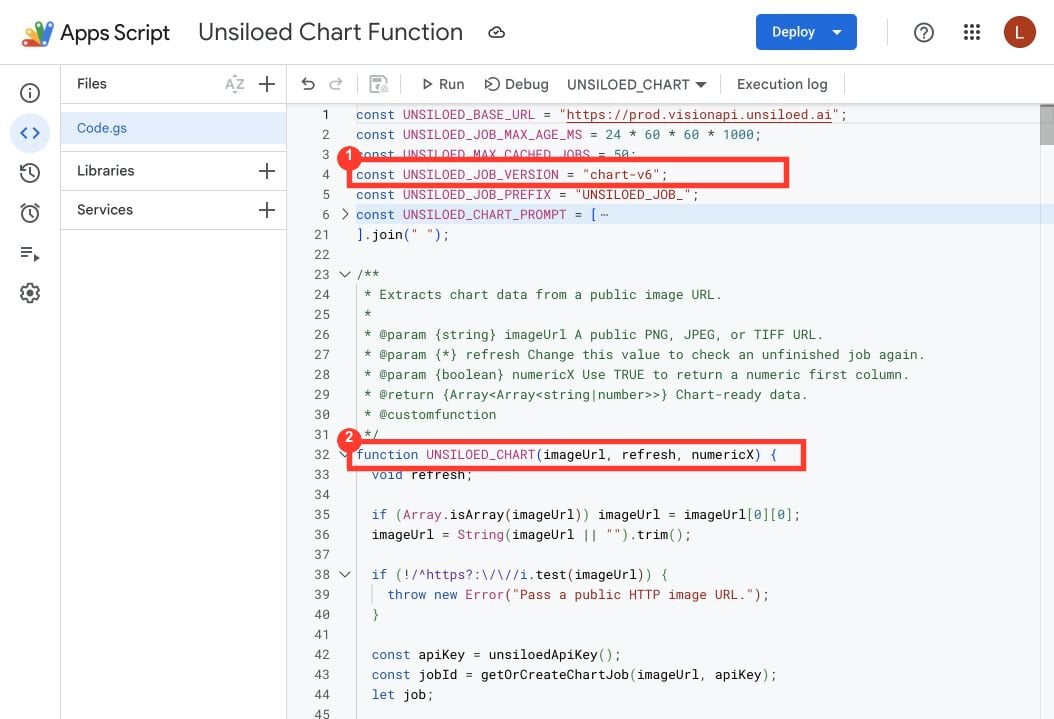 ## Step 3: Store Your API Key
Keep the API key out of spreadsheet cells and source code by storing it as a
script property.
In the Apps Script editor, open **Project Settings** from the left sidebar.
Scroll to **Script Properties**, then click **Add script property**.
Set the property name to `UNSILOED_API_KEY`, paste your API key into its value
field, and click **Save script properties**.
## Step 3: Store Your API Key
Keep the API key out of spreadsheet cells and source code by storing it as a
script property.
In the Apps Script editor, open **Project Settings** from the left sidebar.
Scroll to **Script Properties**, then click **Add script property**.
Set the property name to `UNSILOED_API_KEY`, paste your API key into its value
field, and click **Save script properties**.
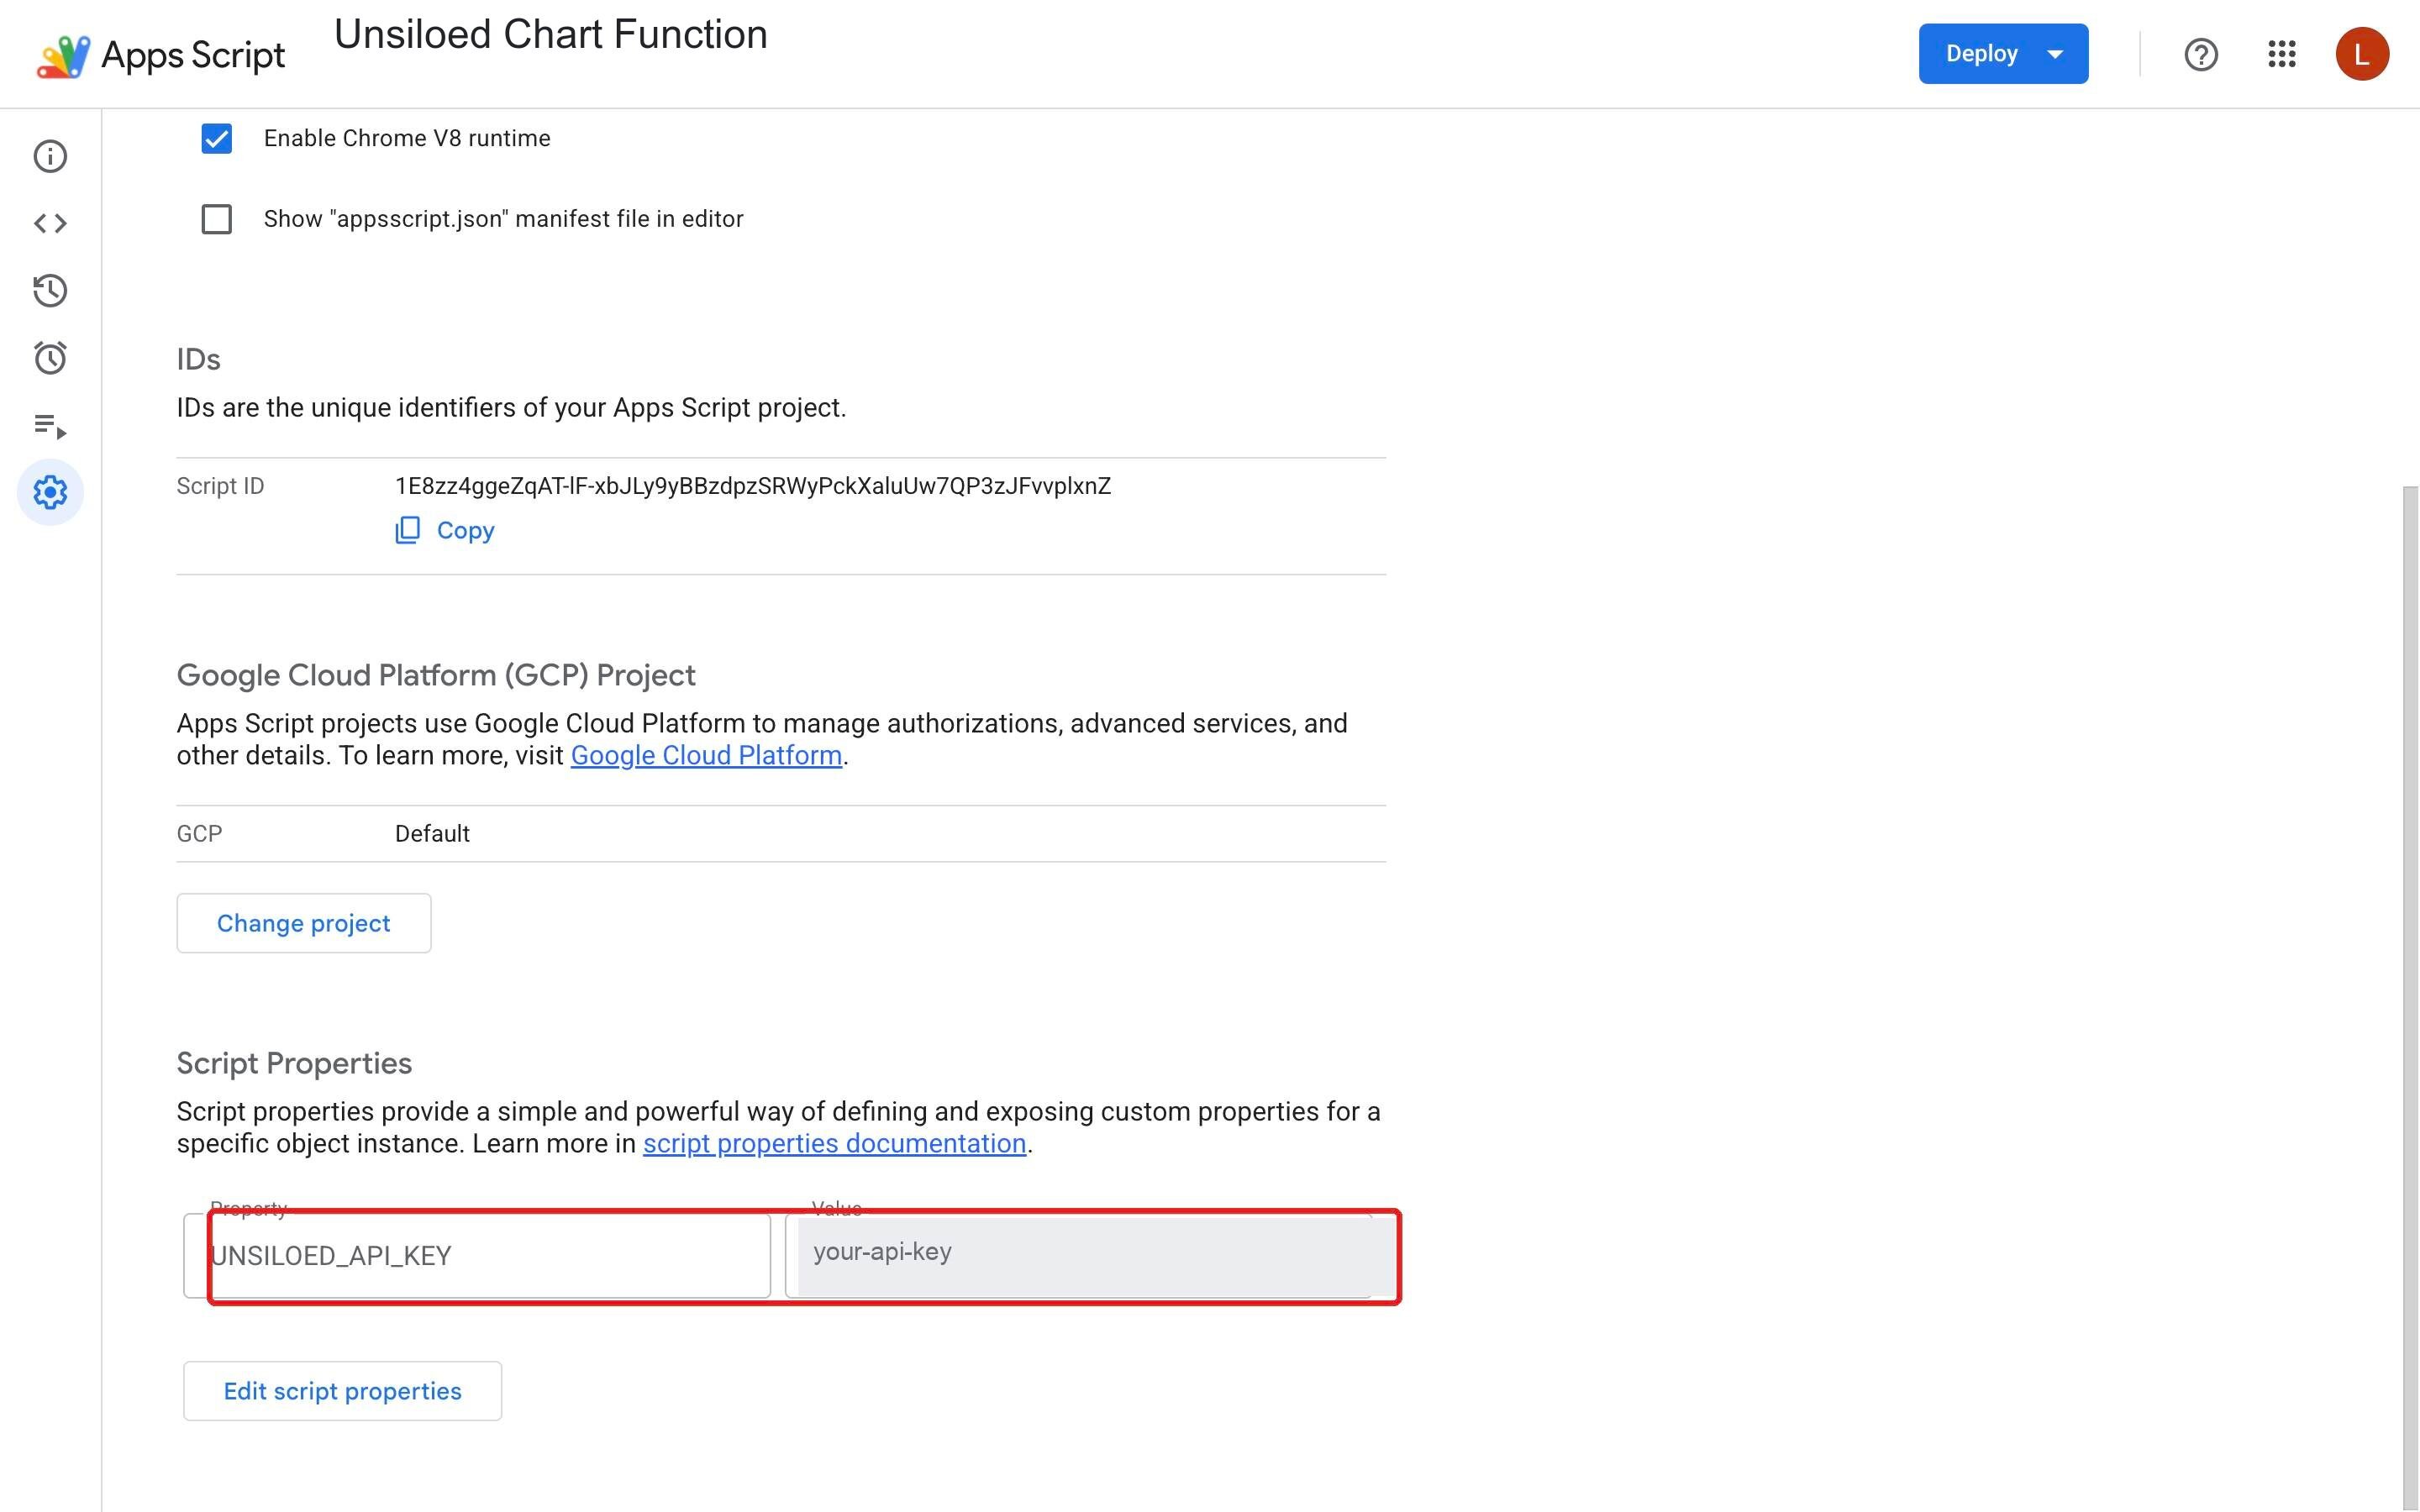 Spreadsheet editors can view its bound Apps Script project and script
properties. Use a dedicated API key, restrict edit access to trusted
collaborators, and rotate the key if the spreadsheet is shared unexpectedly.
Treat presigned image URLs as credentials too, and give them short expiration
times.
## Step 4: Extract the Chart Data
We'll keep the image URL and refresh value separate from the formula so a status
check doesn't require editing the formula text.
Return to the spreadsheet and add these labels and values:
| Cell | Value |
| ---- | ---------------------------------------------------------------------------------------------------------------------------- |
| `A1` | `Chart image URL` |
| `A2` | `https://huggingface.co/datasets/Unsiloed/chart-parse-bench/resolve/ba7316eb4c398963163b8f2d21d97142db1d8ce6/images/D11.png` |
| `B1` | `Refresh` |
| `B2` | `1` |
The red box shows the input range. The URL appears truncated in the cell,
but Sheets retains its complete value.
Spreadsheet editors can view its bound Apps Script project and script
properties. Use a dedicated API key, restrict edit access to trusted
collaborators, and rotate the key if the spreadsheet is shared unexpectedly.
Treat presigned image URLs as credentials too, and give them short expiration
times.
## Step 4: Extract the Chart Data
We'll keep the image URL and refresh value separate from the formula so a status
check doesn't require editing the formula text.
Return to the spreadsheet and add these labels and values:
| Cell | Value |
| ---- | ---------------------------------------------------------------------------------------------------------------------------- |
| `A1` | `Chart image URL` |
| `A2` | `https://huggingface.co/datasets/Unsiloed/chart-parse-bench/resolve/ba7316eb4c398963163b8f2d21d97142db1d8ce6/images/D11.png` |
| `B1` | `Refresh` |
| `B2` | `1` |
The red box shows the input range. The URL appears truncated in the cell,
but Sheets retains its complete value.
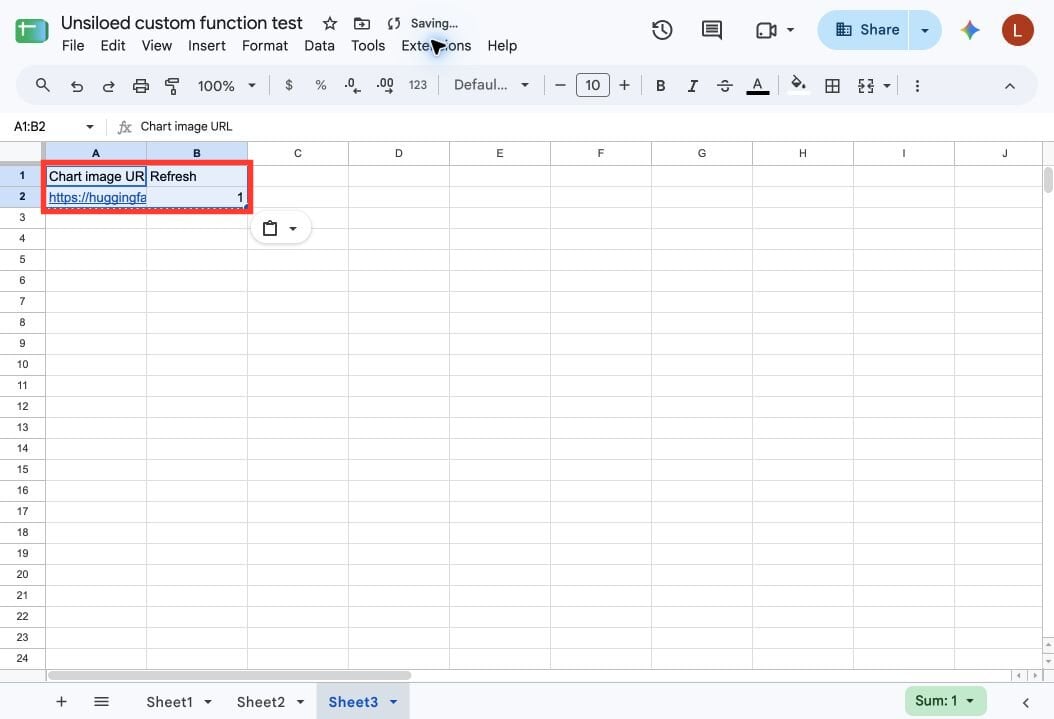 Select `A4` and enter:
```excel theme={null}
=UNSILOED_CHART(A2, B2)
```
For a scatter chart that needs numeric x values, use:
```excel theme={null}
=UNSILOED_CHART(A2, B2, TRUE)
```
Sheets displays `Loading...` while the function submits or checks the parse
job. Keep the cells below and to the right of `A4` empty so the result has
room to expand.
The first calculation may return this status instead of data:
```text theme={null}
Still processing. Change the refresh value to check again.
```
Wait about 20 seconds, then increase `B2` from `1` to `2`. Sheets
recalculates the function and checks the saved job instead of submitting
the image again. Repeat after another short wait if the job is still
processing.
Select `A4` and enter:
```excel theme={null}
=UNSILOED_CHART(A2, B2)
```
For a scatter chart that needs numeric x values, use:
```excel theme={null}
=UNSILOED_CHART(A2, B2, TRUE)
```
Sheets displays `Loading...` while the function submits or checks the parse
job. Keep the cells below and to the right of `A4` empty so the result has
room to expand.
The first calculation may return this status instead of data:
```text theme={null}
Still processing. Change the refresh value to check again.
```
Wait about 20 seconds, then increase `B2` from `1` to `2`. Sheets
recalculates the function and checks the saved job instead of submitting
the image again. Repeat after another short wait if the job is still
processing.
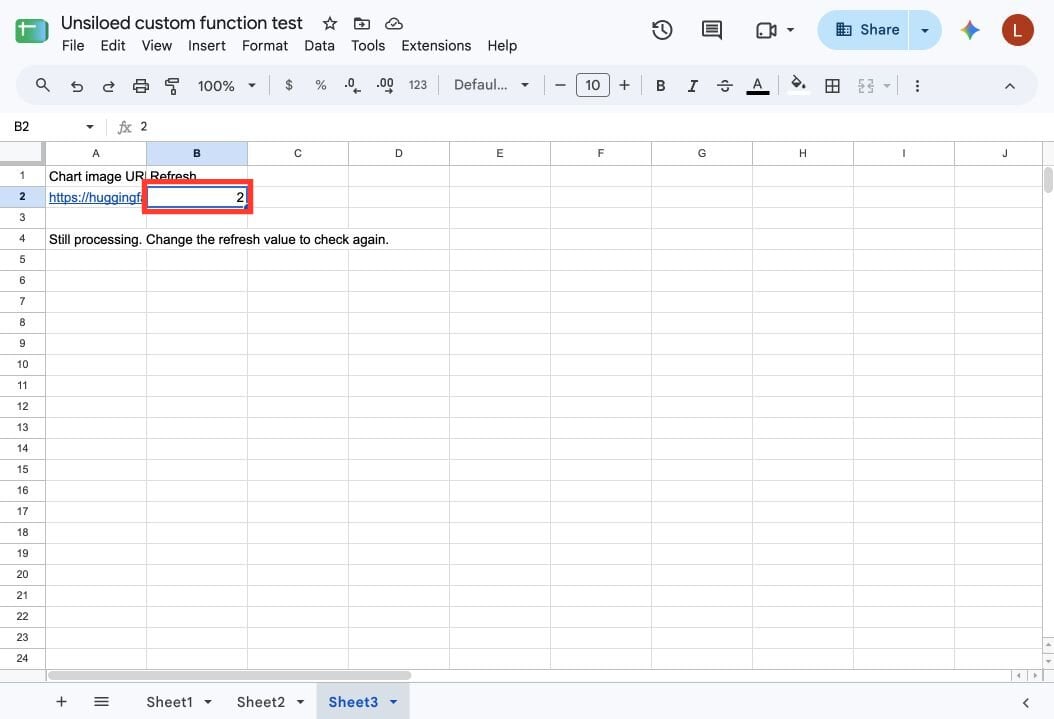 When the job succeeds, the formula expands into the chart's categories and
series.
When the job succeeds, the formula expands into the chart's categories and
series.
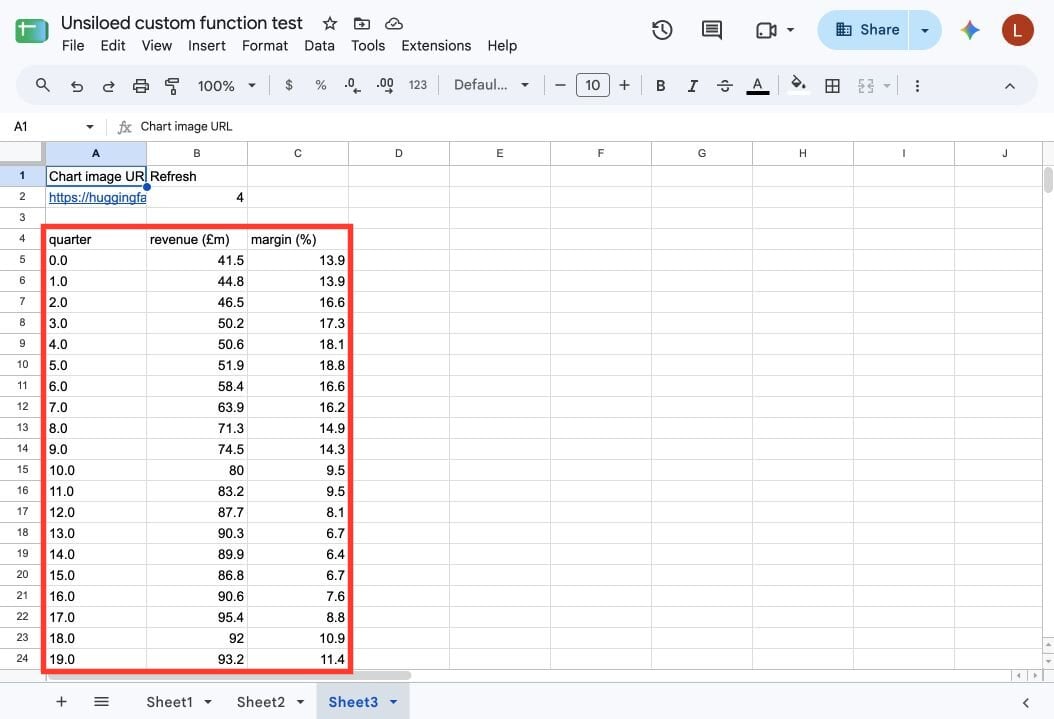 The result contains one row for each of the 20 quarters. Unsiloed keeps the
`revenue (£m)` and `margin (%)` units in the headers while estimating the plotted
values from the chart's pixels. For example, the extracted quarter 7 margin is
`16.2`, while the synthetic source data is approximately `16.15`. Verify values
against source data before using them for consequential decisions.
The margin values use a 0–100 percentage scale, so `13.9` means 13.9%. Don't
apply Sheets' percentage format, which would display that value as 1,390%.
Each image URL reuses a saved job for up to 24 hours, subject to the 50-entry
cache limit. To deliberately submit a fresh job, change
`UNSILOED_JOB_VERSION`, save `Code.gs`, and change `B2`. If you instead delete
its `UNSILOED_JOB_...` script property, also change `B2` to recalculate the
formula.
## Step 5: Recreate the Chart in Google Sheets
The extracted cells become the data source for the native chart.
Select the extracted category and value columns, including their headers. Then
choose **Insert → Chart**.
The result contains one row for each of the 20 quarters. Unsiloed keeps the
`revenue (£m)` and `margin (%)` units in the headers while estimating the plotted
values from the chart's pixels. For example, the extracted quarter 7 margin is
`16.2`, while the synthetic source data is approximately `16.15`. Verify values
against source data before using them for consequential decisions.
The margin values use a 0–100 percentage scale, so `13.9` means 13.9%. Don't
apply Sheets' percentage format, which would display that value as 1,390%.
Each image URL reuses a saved job for up to 24 hours, subject to the 50-entry
cache limit. To deliberately submit a fresh job, change
`UNSILOED_JOB_VERSION`, save `Code.gs`, and change `B2`. If you instead delete
its `UNSILOED_JOB_...` script property, also change `B2` to recalculate the
formula.
## Step 5: Recreate the Chart in Google Sheets
The extracted cells become the data source for the native chart.
Select the extracted category and value columns, including their headers. Then
choose **Insert → Chart**.
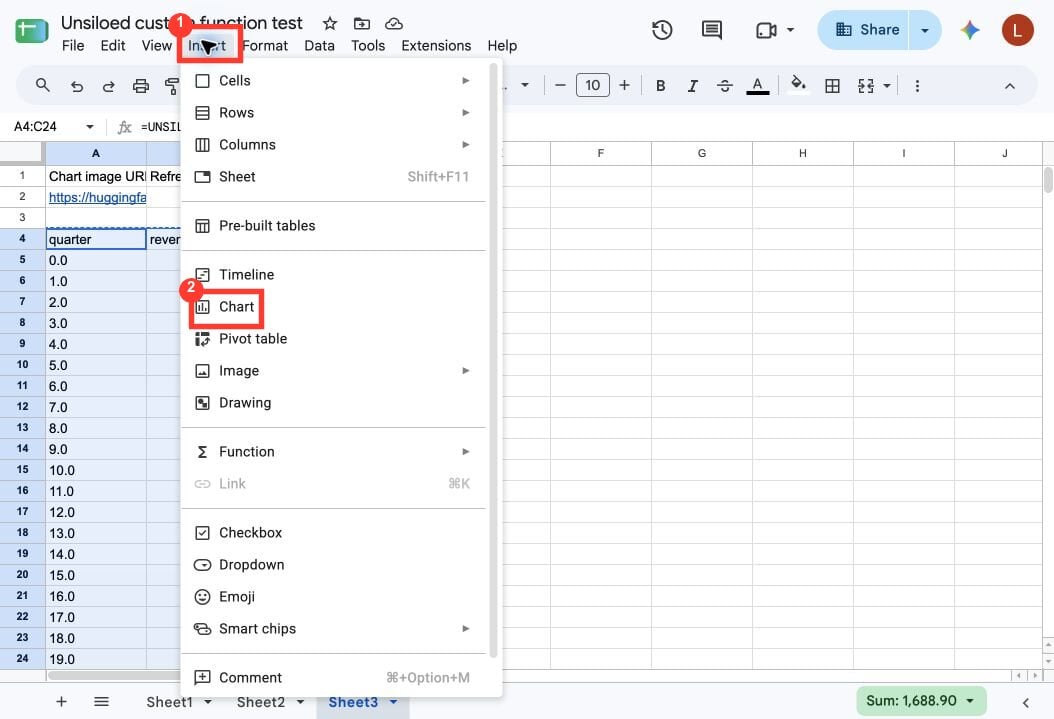 In the Chart editor, choose **Clustered Column - Line on Secondary Axis**. This
uses columns for revenue and a line for margin, matching the source chart's two
scales. Enable **Use row 4 as headers** and **Use column A as labels** if Sheets
doesn't detect them automatically.
In the Chart editor, choose **Clustered Column - Line on Secondary Axis**. This
uses columns for revenue and a line for margin, matching the source chart's two
scales. Enable **Use row 4 as headers** and **Use column A as labels** if Sheets
doesn't detect them automatically.
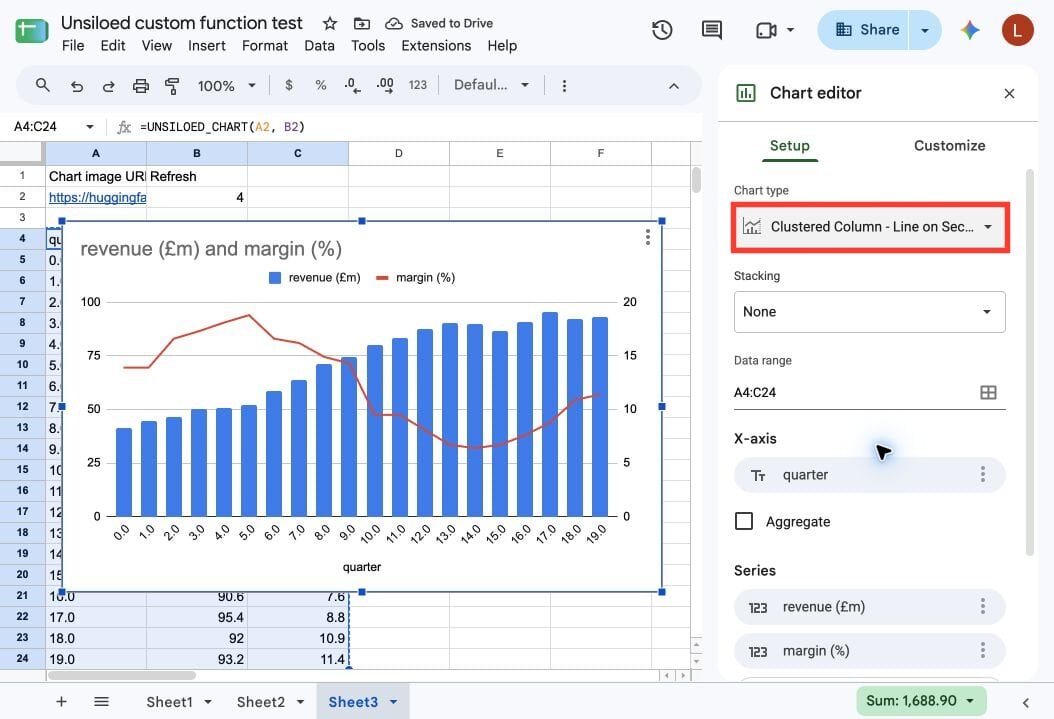 The recreated chart is editable and linked to the extracted cells. It preserves
the extracted categories, estimated values, series types, units, and two axes.
Google Sheets applies its own fonts, spacing, and colors. The source image's
gray highlighted interval is a visual annotation rather than a data series, so
add that styling manually if you need it. Treat the result as a faithful data
reconstruction, not a pixel-for-pixel copy of the source image.
## Troubleshoot the Custom Function
The first argument is empty, a filename, or a non-HTTP value. Put a complete
public or presigned image URL in the referenced cell.
The URL returned an HTML download page instead of image bytes. Use a direct
PNG, JPEG, or TIFF URL.
The bound script has no API key. Add the property in [Step
3](#step-3-store-your-api-key). Script properties aren't copied with a
spreadsheet, so add it again in the copied sheet's script project.
Wait about 20 seconds, then change the refresh value. The next calculation
resumes the existing job. Apps Script stops custom functions after 30
seconds, so a slow parse can require more than one check.
Another calculation briefly held the script lock. Change the refresh value
after a few seconds. This reuses the existing job when one is available.
Temporary HTTP errors usually resolve on a later refresh. For an account or
credit error, check the Unsiloed dashboard before retrying.
Clear the cells below and to the right of the formula. Sheets doesn't let a
spilled array overwrite existing values.
Some spreadsheet locales use semicolons between arguments. Enter
`=UNSILOED_CHART(A2; B2)` instead.
Chart extraction reconstructs values from pixels. Small labels, overlapping
marks, unlabeled ticks, and compressed images can reduce fidelity. Use the
highest-resolution source available and verify decision-critical values
against the original image.
## Choose Between a Formula and a Menu Command
Use this custom function when one public chart image should produce one dataset
at the formula location. Use the [menu-driven table extraction
guide](/docs/cookbooks/spreadsheets/google-sheets-extract-table) when you need to read
an image stored inside a cell, create a new worksheet, or process several source
images in one run.
See how Unsiloed evaluates chart accuracy and point density.
Run a menu command that reads an image and writes a new worksheet.
Review the parse workflow and the document structures it returns.
Connect a spreadsheet to Unsiloed and compare workflow patterns.
The recreated chart is editable and linked to the extracted cells. It preserves
the extracted categories, estimated values, series types, units, and two axes.
Google Sheets applies its own fonts, spacing, and colors. The source image's
gray highlighted interval is a visual annotation rather than a data series, so
add that styling manually if you need it. Treat the result as a faithful data
reconstruction, not a pixel-for-pixel copy of the source image.
## Troubleshoot the Custom Function
The first argument is empty, a filename, or a non-HTTP value. Put a complete
public or presigned image URL in the referenced cell.
The URL returned an HTML download page instead of image bytes. Use a direct
PNG, JPEG, or TIFF URL.
The bound script has no API key. Add the property in [Step
3](#step-3-store-your-api-key). Script properties aren't copied with a
spreadsheet, so add it again in the copied sheet's script project.
Wait about 20 seconds, then change the refresh value. The next calculation
resumes the existing job. Apps Script stops custom functions after 30
seconds, so a slow parse can require more than one check.
Another calculation briefly held the script lock. Change the refresh value
after a few seconds. This reuses the existing job when one is available.
Temporary HTTP errors usually resolve on a later refresh. For an account or
credit error, check the Unsiloed dashboard before retrying.
Clear the cells below and to the right of the formula. Sheets doesn't let a
spilled array overwrite existing values.
Some spreadsheet locales use semicolons between arguments. Enter
`=UNSILOED_CHART(A2; B2)` instead.
Chart extraction reconstructs values from pixels. Small labels, overlapping
marks, unlabeled ticks, and compressed images can reduce fidelity. Use the
highest-resolution source available and verify decision-critical values
against the original image.
## Choose Between a Formula and a Menu Command
Use this custom function when one public chart image should produce one dataset
at the formula location. Use the [menu-driven table extraction
guide](/docs/cookbooks/spreadsheets/google-sheets-extract-table) when you need to read
an image stored inside a cell, create a new worksheet, or process several source
images in one run.
See how Unsiloed evaluates chart accuracy and point density.
Run a menu command that reads an image and writes a new worksheet.
Review the parse workflow and the document structures it returns.
Connect a spreadsheet to Unsiloed and compare workflow patterns.